European net LNG imports in H1 2018 did not sustain the growth momentum which was seen in 2017 (nearly 5% Y-o-Y growth in H1 2017) as total LNG net imports fell by 5% (-1.21 MT YoY) to reach 21.2 MT. This trend was mainly the result of higher re-exports, which went up 1.1 MT YoY, and strong declines in net LNG imports in Spain, the UK and France.
In Southern Europe, net LNG imports were down 8.7% to 12.1 MT, as imports in France, Spain and Italy declined. LNG imports in Spain declined by 12 % (-0.65 MT), counterbalanced by pipeline imports from Algeria which grew 18% compared to last year. Spanish LNG imports from Peru were down by 0.88 MT and this was partially offset by increased purchases from Trinidad and Tobago (+0.67 MT). In France, re-exported volumes surged by 0.72MT YoY, resulting in a 10% decline (-0.4 MT) in net LNG imports. The re-exported cargoes from France landed mainly in Asia (China, South Korea, India) and the Middle East (Kuwait). In Italy, LNG imports were down by 10% (-0.28 MT) as the power sector gas demand weakened in H1 2018, while hydroelectric power generation increased. Portugal was the only Southern European country where LNG imports were up, albeit marginally (+ 0.15 MT).
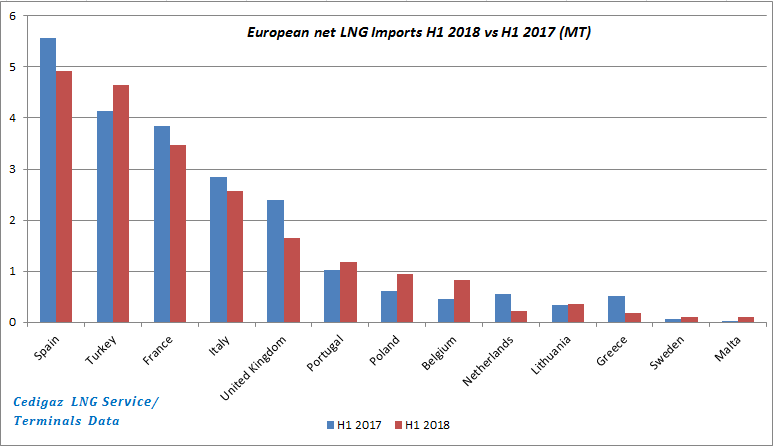
Figure 1: European LNG Importers in H1’18 (net of re-exports)