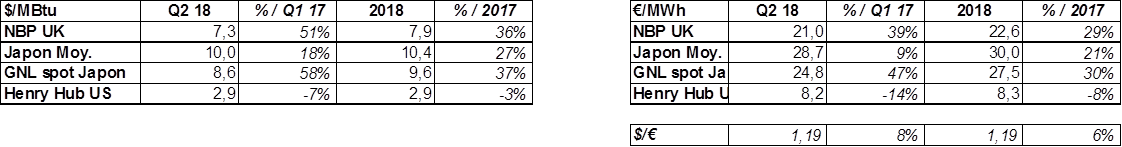
– In Asia, the average price of gas imports to Japan has risen since year-end 2017 in step with the uptrend in the oil price. LNG spot prices are under pressure and approaching those of oil-indexed contracts.
– These conditions have affected the European market, where price levels for Q2 and Q3 are relatively high.
– In the U.S., the Henry Hub price was lower in Q2 than Q1, due to the magnitude of U.S. natural gas output.
Globally, based on current information, average 2018 prices look to be up sharply in Europe (+36%) and Asia (+30-40%), but down in the United States (-3%).
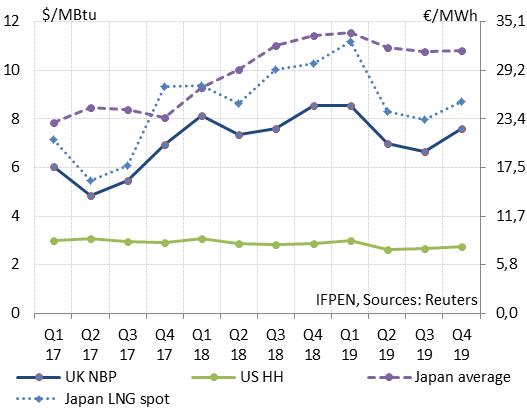
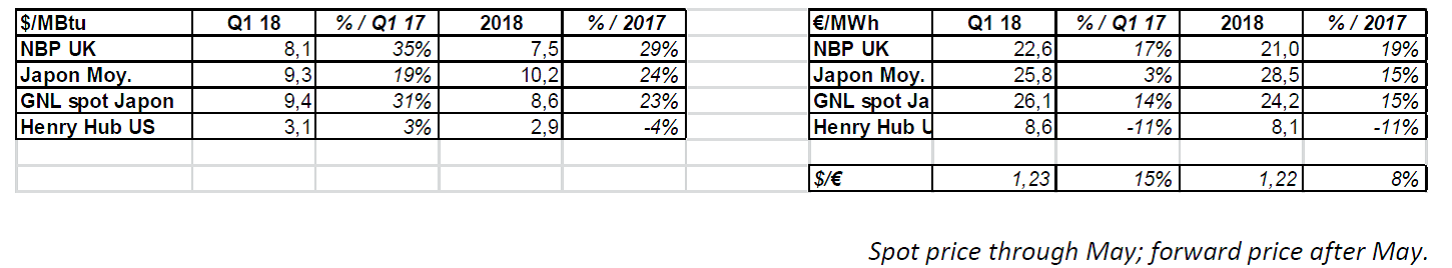
Figure 1: 2017-19 gas price, by quarter: United Kingdom, Japan and the United States ($/MBtu and €/MWh)
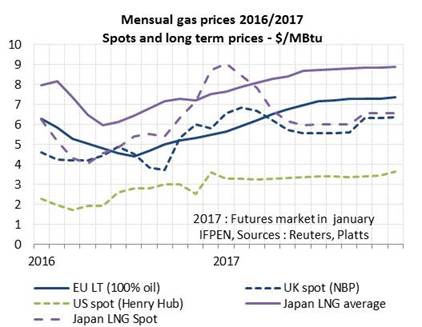
Gas prices rose in Q1, mainly owing to a harsh winter (Fig. 1). Since then, they have declined, as is usually the case in spring and summer. The gas prices in Europe and Japan should be higher this year than last year, due to the uptrend in the oil price and its impact on Asian oil-indexed contracts and winter spot prices. For this summer, the increase in the CO2 price in Europe (+110% in one year) has created a higher reference for the gas price. These trends do not pertain to the U.S. market, where the price has tended to remain stable or fall.
Gas price, by quarter: U.K., Japan and the U.S. ($/MBtu and €/MWh)
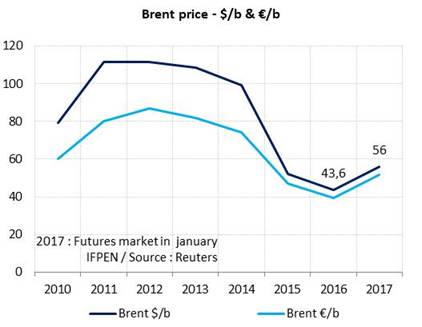
For the last six months, the estimated Brent price for 2017 has been in the $50-56/b range, up from $43.6/b in 2016, i.e. a potential gain of between 16 and 30%. This market scenario is based on the following assumptions for 2017: oil demand will rise significantly (+1.3 Mb/d according to the International Energy Agency), observance of the OPEC/non-OPEC output agreement of 2016 will be fairly good, and production in Libya, Nigeria and the United States will see a slight increase (+0.3 Mb/d). It is not clear whether all three of these assumptions will hold true. If the agreement is strictly upheld without a notable increase in U.S. supplies, the resulting pressure would most likely push the price past $60/b. Inversely, if the agreement is not well observed and U.S. supplies increase sharply between now and the end of 2017, the price could end up below $50/b. Both of these contrasting scenarios are credible, so the oil price volatility seen in 2016 will probably continue this year.
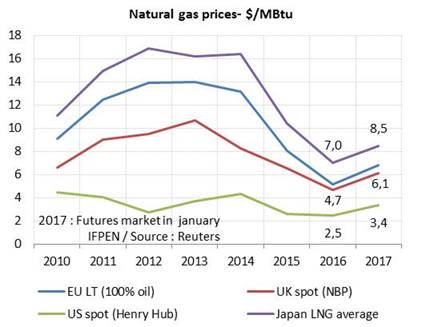
NBP: €16-19/MWh for 2017 (€14.4/MWh; $4.7/MBtu in 2016)
Natural Gas prices
The 2017 gas market price in the United Kingdom (NBP) should be between €16 and 19/MWh ($5-6/MBtu), versus €14/MWh ($4.7/MBtu) in 2016, i.e. a gain of between 11 and 33%.
Since 2013 (€27/MWh; $10/MBtu), the gas price has steadily dropped for different reasons: economic growth has been sluggish, coal was more competitive than gas until 2015, the winter of 2015-16 was mild, and the oil price fell in 2015 and 2016. These factors drove the gas price to an especially low level in 2016. For 2017, the markets are forecasting prices of about €21/MWh ($6.5/MBtu) for winter and €18/MWh ($5.6/MBtu) for summer. The actual level will depend on the stocks draw (a function of winter weather conditions) and on the oil price.
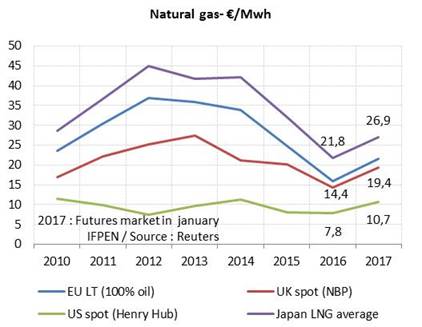
Indexed European prices: €18-22/MWh in 2017 (€15.9/MWh; $5.2/MBtu in 2016)
Natural gas – Euros
In Europe, the price of 100% oil-indexed contracts could gain between 13 and 37% in 2017. The upper limit value is based on mid-January forecasts for the Brent price ($56/b) and the euro ($1.07).
This type of contract is used less and less in Europe. In France, for instance, it is estimated that nearly 80% of contracts are now indexed to market prices (short-term, spot or equivalent). Nevertheless, oil-indexed contracts continue to have an influence, serving as a yardstick for prices in a tight market. This occurs in winter, when spot prices for gas are likely to approach or exceed long-term prices, depending on the severity of the weather conditions. On the other hand, spot prices in summer are generally lower than the indexed prices.
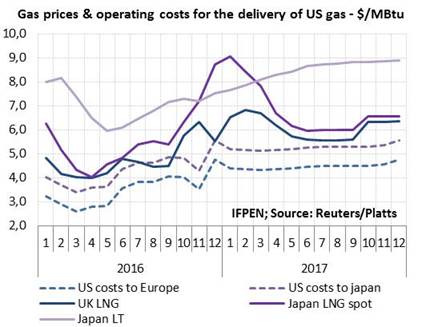
The indexed prices in Asia could reach €27/MWh in 2017 ($8.5/MBtu) compared to €21.8/MWh ($7.1/MBtu) in 2016. Unlike in Europe, long-term oil-indexed contracts still represent a preponderant share of supplies: 70% in 2014, according to the EIA. The historic purchasers of LNG are trying to renegotiate the historic formulas applied to long-term contracts. They wish to improve the coefficients linking the price of gas to that of oil and strengthen references to spot market quotations. They are also seeking larger spot-based deliveries, especially from the United States. These short-term prices came under fairly strong pressure between December and January, reaching $9/MBtu, thus exceeding the price of long-term contracts. The markets expect demand to fall off in the spring, at which time the gap between European and Asian spot prices should narrow?.
Henry Hub: $3-3.5/MBtu in 2017 ($2.5/MBtu in 2016)
Mensual gas prices 2016-2017
In the United States, it is thought that the Henry Hub price for 2017 will be in the $3-3.5/MBtu range. Compared to the 2016 price of $2.5/MBtu (€7.8/MWh), this would represent a progression of between 19 and 37%.
2016 was marked by a drop in production and cold winter conditions making it necessary to draw on stocks. These two factors explain why the price rose during the year. For 2017, the production increase should be absorbed by growth in demand and, especially, in exports (+15 bcm for LNG). This should lead to a downdraw estimated at 10 bcm, like in 2016 but in contrast with year-end 2015, when there was an accumulation of stocks (+21 bcm). The U.S. price, expected to come under pressure for these reasons, remains fairly low compared to the prices in Europe and Asia. In any case, the projected stock level is a parameter that will help determine the equilibrium price for the United States.
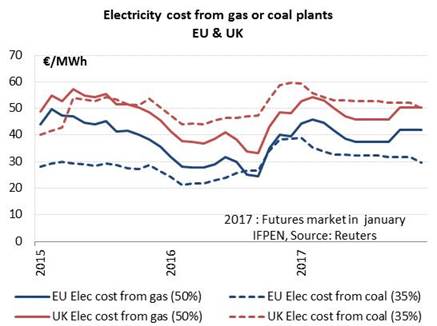
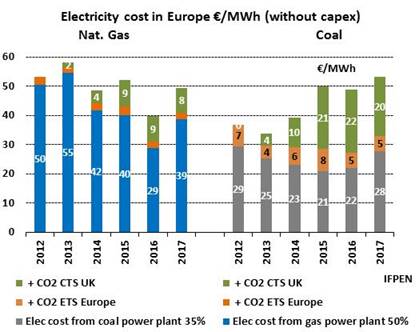
The impact of gas and coal price trends on the cost of electricity in Europe
Along with higher gas prices, the markets expect 2017 to bring a sharp increase in the coal price, whose annual average should jump from $59/t to 76/t. However, the coal price is expected to decline steadily throughout the year.
These two energies play a significant role in the formation of the electricity price. In the United Kingdom, the price is primarily based on the maximum cost of producing electricity from coal or gas. The parameters are a bit more complex in France or Germany.
One must also account for the fact that different CO2 prices are retained: €5/TCO2 for Europe versus €26/TCO2 for the U.K. (including the carbon tax). Since the carbon tax doubled in April 2015, it has ensured that gas is competitive with coal in the U.K., which will continue in 2017. On the Continent, however, gas will be less competitive than coal. One notes that the carbon tax increases the cost of generating electricity, which is why electricity market prices are higher in the United Kingdom (€50/MWh in 2016) than on the European continent (€30/MWh in Germany and €34/MWh in France).
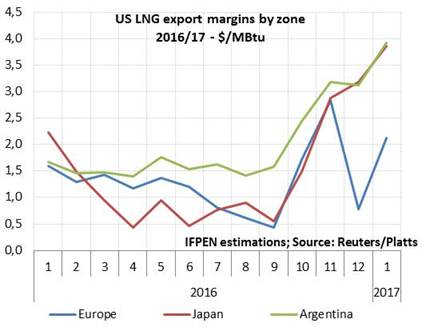
In 2016, about 60% of U.S. LNG exports went to South America, followed by the Middle East (20%), Asia (14%) and Europe (6%). U.S. LNG exporters could get higher margins in South America, which explains this breakdown.
In 2017, U.S. LNG exports should be around 15 bcm. Like last year, the margins will determine the destination of these quantities, still marginal in the market as a whole. The first indications based on market price forecasts give the European market a slight advantage. However, said advantage is not decisive and things can change in the course of the year.
For now, there is no clear connection between regional prices and the cost of delivered U.S. LNG, including shipping. But eventually, given the build-up of U.S. exports, some think that a reference price will gradually be set for each region based on the delivery cost of U.S. LNG, including shipping. It would have to correspond to the last volume required to balance the market, i.e. the “cargo of last resort” (the marginal supply). This is not going to happen anytime soon, unless, perhaps, if a period of low demand occurs, especially in summer. And, looking at the near future, this scenario doesn’t seem credible on an annual basis, not unless a particularly mild winter occurs and demand for LNG slumps.
The prices for 2017 reflect past and present trends in forward prices as of end January, but are not forecasts and should not be considered as such. Economic, climate-related and/or geopolitical factors can have a strong impact on future trends.