NBP: A return of the 2014 scenario?
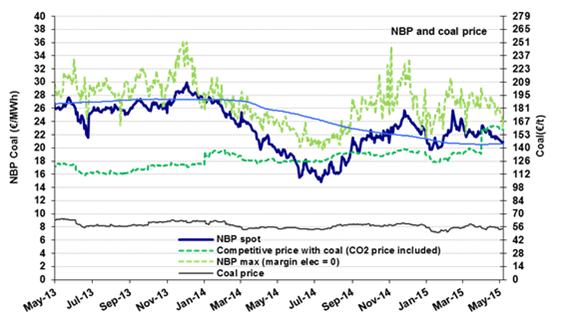 The NBP price averaged €22.1/MWh ($7.0/MBtu) in April, down by 1% over March. There is greater downward pressure on the quotations for early May, which are at €20.9/MWh ($6.8/MBtu), close to the levels predicted by the markets for this summer (€20.4/MWh on average). A return of the 2014 scenario, with its sharp drop in prices during the summer (€16-17/MWh between June and August 2014) remains possible this year: demand is lower than in the past, especially in the power sector (20 bcm since 2012 compared to 30-35 bcm before then; the market share for natural gas has fallen from 41% in 2011 to 29%; renewable energies are up from 9 to 17%).