THE GLOBAL GAS MARKET IN 2018

Natural gas supply and demand grew at their fastest pace since 2010 

Natural gas consumption by regionAccording to CEDIGAZ report “The Global Gas Market – 2019 Edition”, 2018 has been a remarkable year for the global natural gas market.

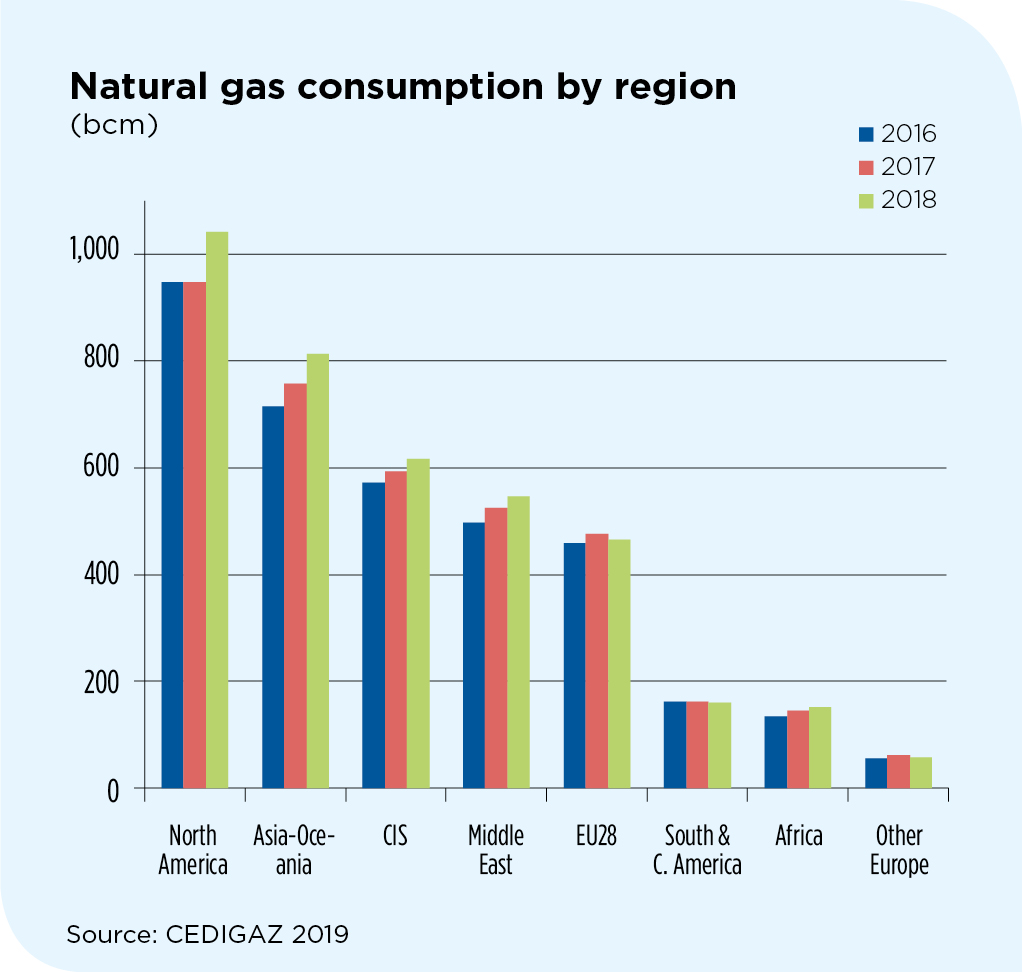
Global natural gas demand surged 4.7% to 3850 bcm, driven by the US and China. The US was the standout performer, accounting for 45% of the global increase in both the consumption and supply of natural gas.

2018 marks the second year of strong growth of natural gas demand, after a 3.5 % rise in 2017. It also recorded the highest growth of gas demand since the post-crisis rebound of 2010.

This fast expansion was driven by the abundance of competitive gas supply, especially in the US and in Russia and by supportive energy and environmental policies, in some countries, particularly in China. Investment in transport infrastructure also contributed to bolster gas penetration in key markets.

China became the largest net importer of natural gas in the world before Japan. Chinese net imports jumped by 32% and accounted more than 80% of the global increase in net imports, once again highlighting the crucial role of China in absorbing global gas production.

Like in 2017, the expansion of natural gas demand was part of a substantial global growth in world energy demand, driven by a robust global economy and extreme weather conditions.

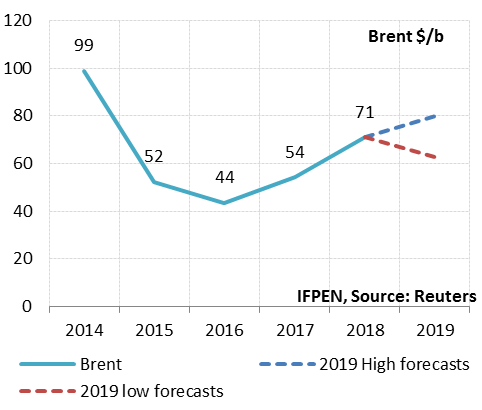
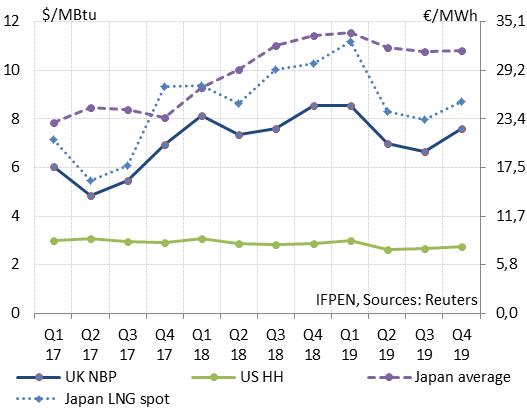
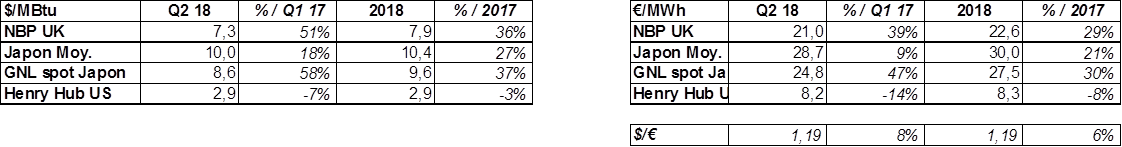
Strong gas demand growth in Asia contributed to a rise in market prices in key areas and prevented the formation of a global LNG bubble.

Quarterly report – Oil and natural gas prices

  • Brent: between $60 and $80/b in 2019 (2018: $71/b)

The oil price oscillated between $50 and $86/b in 2018, averaging $71/b (+31% compared to 2017). The volatility observed in 2018 was due in large part to uncertainty about supply and economic growth, but also to the U.S. sanctions against Iran. Initially announced as being extremely severe, the embargo was softened at the last minute by the American president when he realized the likely consequences of a rise in the price of oil products.

For 2019, the average Brent price is expected to be in the $60 to 80/b range. These expectations account for different scenarios for factors such as economic growth, the Iran embargo, OPEC’s management of supply and U.S. production.

Brent: between $60 and $80/b in 2019

  • NBP: €19-23/MWh in 2019 (€23.3/MWh; $8.1/MBtu in 2018)

Based on forward prices and expected oil prices, the average UK NBP price for 2019 could fall between €19 and 23/MWh ($6.5-7.8/MBtu) compared to €23,3/MWh ($8.1/MBtu) in 2018, representing a potential decrease of between 1 and 18%.

Quarterly report – Natural gas prices

– In Asia, the average price of gas imports to Japan has risen since year-end 2017 in step with the uptrend in the oil price. LNG spot prices are under pressure and approaching those of oil-indexed contracts.

– These conditions have affected the European market, where price levels for Q2 and Q3 are relatively high.

– In the U.S., the Henry Hub price was lower in Q2 than Q1, due to the magnitude of U.S. natural gas output.

Globally, based on current information, average 2018 prices look to be up sharply in Europe (+36%) and Asia (+30-40%), but down in the United States (-3%).


Figure 1: 2017-19 gas price, by quarter: United Kingdom, Japan and the United States ($/MBtu and €/MWh)

2017-19 gas price, by quarter


Global trends

Global trends