In 2024, global natural gas demand was estimated to have recorded a strong 2.9% growth, to stand at a new record of 4166 bcm, representing an annual incremental volume of 118 bcm. By way of comparison, growth over the pre-crisis period 2010-2019 stood at 2.4 %/year. This rebound was partly due to structural growth factors, which are expected to persist in the long term, including energy policies in favour of the expansion of gas, the booming Asian gas market, the growing role of gas as a dispatchable electricity source supporting intermittent renewables, increased use of LNG for transportation and more sudden and extreme climatic events which reinforced the crucial role of gas-fired power generation for peak load. On the supply side, global marketed natural gas production increased more moderately by 1.7% to 4159 bcm, driven predominantly by Russia, China and Norway. Despite tight LNG supplies, demand continued to grow robustly as major consumer markets tapped into their abundant stocks during periods of market tensions to ensure gas supply security and flexibility. In this context, European and Asian spot prices softened from the previous year but remained elevated. High price volatility reflected unforeseen events on both the supply and demand sides, including geopolitical tensions and extreme weather events.
Natural Gas Statistics
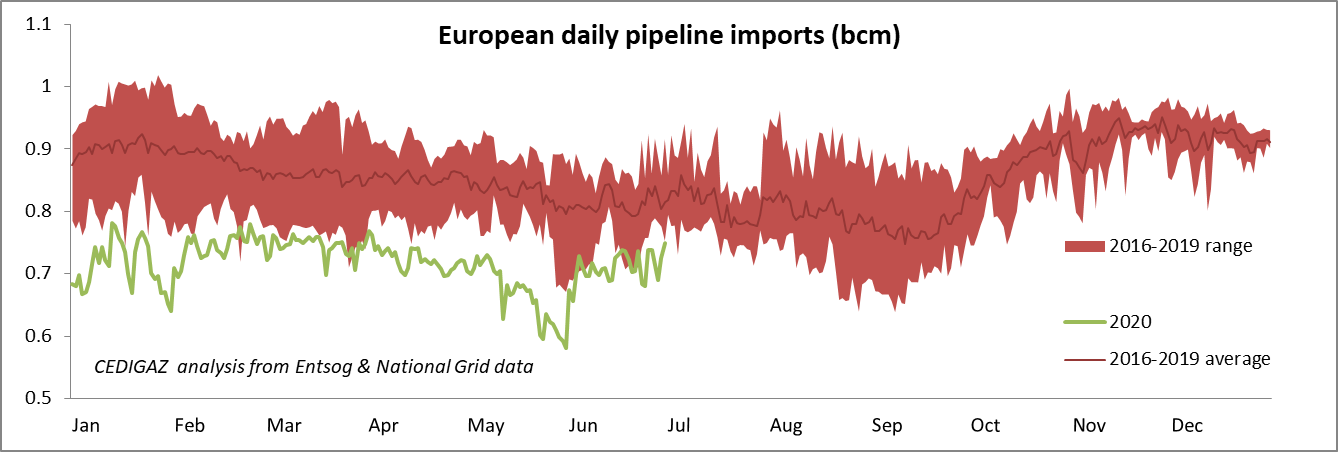
EUROPEAN PIPELINE GAS IMPORTS – First semester 2020
European[1] gas imports by pipeline were relatively stable in H1 2020 but down 19% year on year
Monthly pipeline gas flows to Europe were surprisingly quite stable in the first half of 2020, with a minimum estimated at 20.6 bcm in May against a maximum 23.1 bcm in March. However compared to last year, pipeline imports were down by 18% in the first quarter and 20% in the second quarter. Overall, European pipeline imports stood at 130 bcm in the first semester of 2020, an estimated 30 bcm (-19%) decline compared to the same period last year. Remarkably, daily flows remained below the minimum recorded in the 2016-2019 period on almost every day of the semester.
Global LNG Review – May 2020
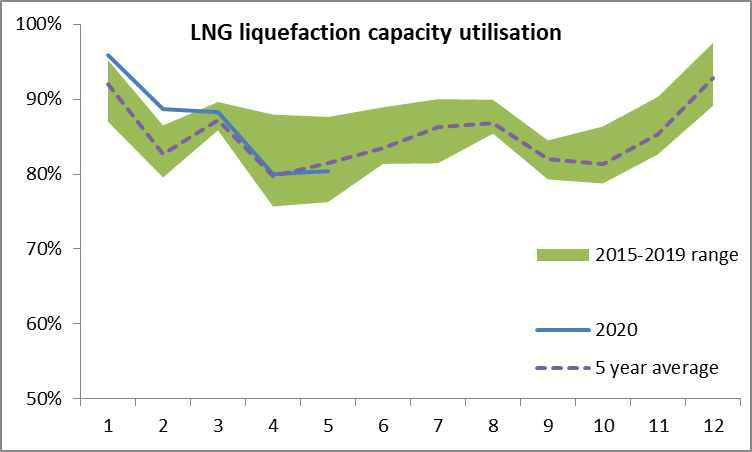
Global LNG trade remained stable year on year in May 2020 amid extremely depressed prices
Global LNG net imports* were up 0.46 Mt in May 2020 compared to April and essentially stable year-on-year (-0.2%) after a 2% Y-o-Y decline in April. These figures contrast with the 11.5% Y-o-Y growth recorded in Q1. Global net imports in May were 13% below January’s which demonstrates a certain level of supply response to low prices but is also largely a seasonal phenomenon. Indeed, in the five year period between 2015 and 2019, the decline in monthly imports from January to April has varied from -20% in 2015 to -6% in 2017.
LNG exports in May 2020 represented approximately 82% of the global liquefaction installed capacity which was only marginally lower than the average capacity utilization at this time of the year over the 5 previous year. They increased by 1% compared to May 2019, with the largest increases in the United States, Nigeria, Algeria and the Russian Federation, reflecting higher capacity utilization in the latter three countries and the launch of a number of new liquefaction trains in 2019 and early 2020 in the United States, where nominal liquefaction capacity increased from 34 to 65 Mtpa between May 2019 and May 2020.
Source: CEDIGAZ