News
Russian gas in Europe: Yesterday, Today, Tomorrow.
An in-depth analysis of recent developments and prospects in Europe-Russia gas relations
With quality information from Russia getting increasingly scarce, the Russian natural gas market has become more and more of a black box. In its latest report “Russian gas in Europe: Yesterday, Today, Tomorrow. An in-depth analysis of recent developments and prospects in Europe-Russia gas relations”, CEDIGAZ tracks the unprecedented changes between glorious “yesterday” (2018-2021), gloomy “today” (2022-Q1 2023) of Russian gas (both pipeline and LNG) in Europe, including the evolution of the European countries’ dependence on Russian gas, using data still available. The report also discusses possible futures for Russian gas in Europe after 2023 (“tomorrow”) – given new inputs, including selected pipeline export routes limitations, the Turkish natural gas hub initiative, and Russian LNG project developments.
The LNG market in June 2020 : Qatar at full speed, US in slow motion.
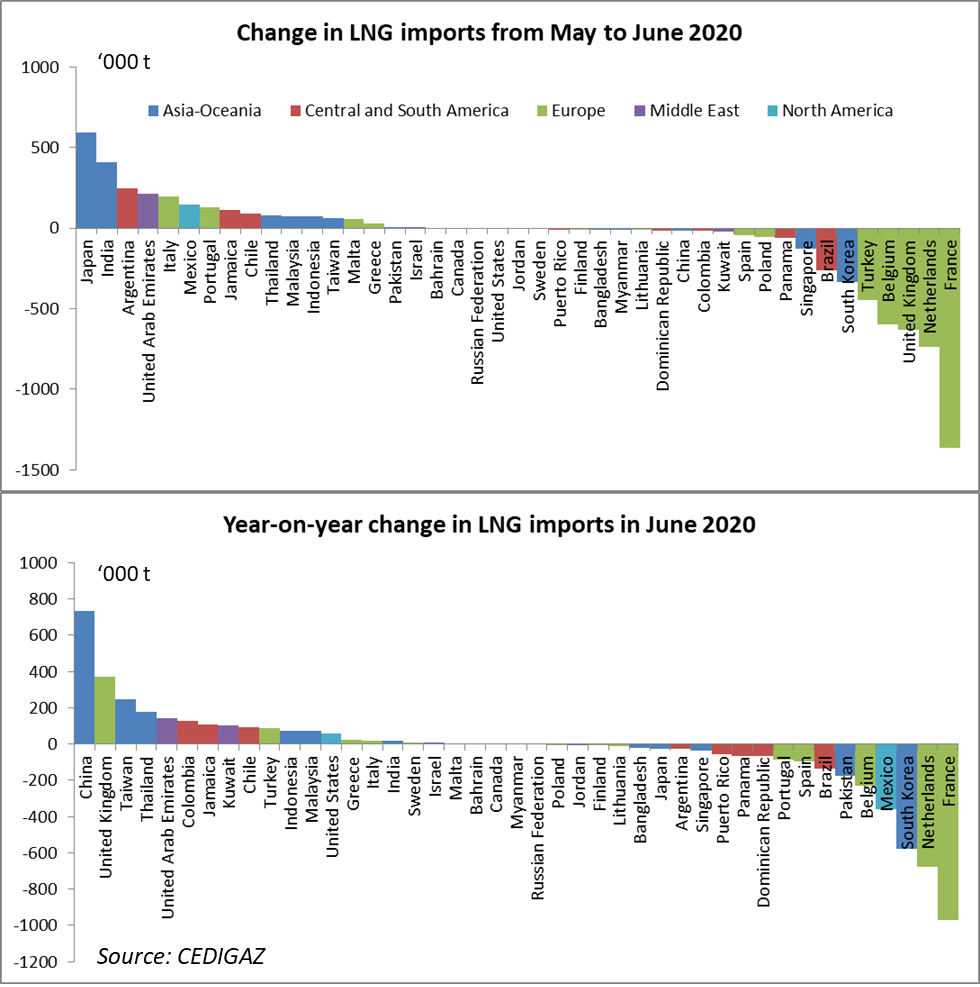
Global LNG import[1] decline accelerated in June. Preliminary data[2] point to an 8% drop (-2.3 Mt) compared to May and a 4.2% decline (-1.2 Mt) year-on-year. Global net imports stood at an estimated 26.3 Mt, which is equivalent to only 72% of global liquefaction capacity, a level significantly below the 5 year capacity utilization range in June for the 2015-2019 period (81-89%). This signals a growing oversupply in the first semester as capacity utilization had remained within the 5 year range until May and shows that the LNG market flexibility needed to absorb the surplus is being stretched to its limits.
The strong decline in June is due to Europe where imports nosedived in several major importing countries : France (- 1.4 Mt), Netherlands (-0.7 Mt), UK (-0.6 Mt), Belgium (-0.6 Mt) and Turkey (-0.5 Mt). Overall European imports (including Turkey) were down 40% in June compared to May (-3.5 Mt). All other regions registered modest growths. In particular imports grew by 0.8 Mt in Asia essentially thanks to Japan (+0.6 Mt) and India (+0.4 Mt) while they declined in South Korea (-0.3 Mt) and remained almost stable in China. The year-on-year picture is less dramatic with imports down by 1.5 Mt (-23%) in Europe, essentially due to France and the Netherlands and up 0.5 Mt in Asia essentially because of China (+0.7 Mt) while South Korean imports declined by 0.5 Mt.

