GLOBAL OVERVIEW
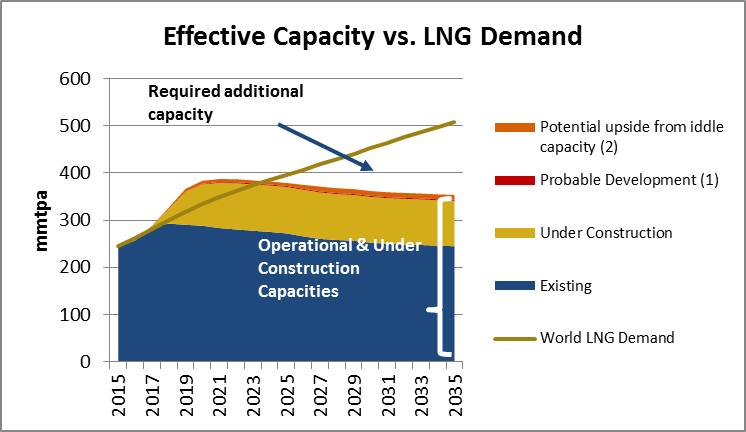
- Total effective capacity[1] is expected to increase significantly from 244 mmtpa in 2015 to 387 mmtpa in 2021 (+60%). Subsequently, effective capacity from facilities currently operational or under-construction should progressively decrease to reach 354 mmtpa by 2035 due to the aging of some assets and gas shortages in some producing countries. Demand will struggle to keep up with supply ramp-up at the beginning of the projection period and an over-supply situation should prevail. Rebalancing of the market is not expected before 2023, or even 2024 if probable developments (Fortuna FLNG) and potential upside from currently idle capacity (Egypt, Yemen) are taken into account. After that, the continuous growth of the LNG market will leave a large margin for the implementation of new projects.
Effective Capacity vs LNG demand

(1): Equatorial Guine (2): Egypt, Yemen
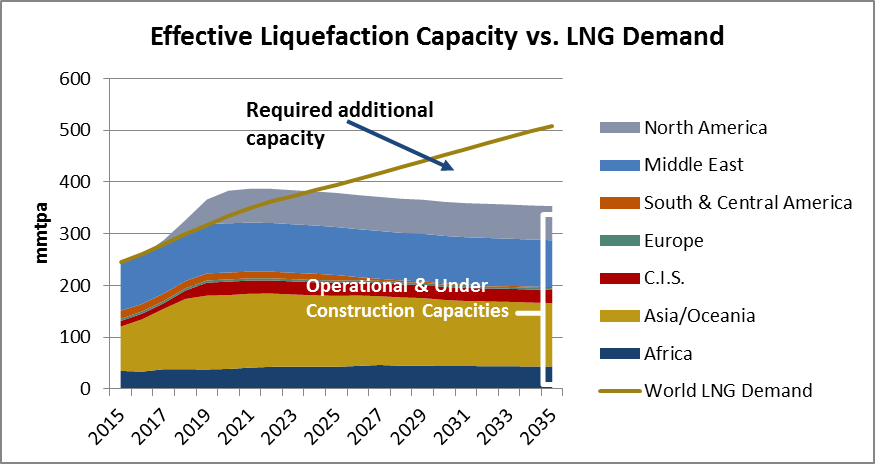
- Three main regions stand out: Asia-Oceania, the Middle East and North America. Effective liquefaction capacity in Asia-Oceania is expected to see a significant increase reaching a plateau between 2019 and 2023 and then decreasing until 2035. Capacity in the Middle East remains broadly stable throughout the period with just over 90 mmtpa of effective liquefaction capacity, although Qatar’s recent announcement calling for a 30% production growth to 2024 could change the game. In North America the stepping up of United States’ LNG will constitute a major upheaval, with a total liquefaction capacity expected to reach 66 mmtpa by 2021 (Canada included).
- LNG capacity in Africa and the CIS should remain stable after a slight increase at the beginning of the projection period. Stability is also expected in Europe, while effective capacity will gradually decrease in South & Central America due to growing constraints on feedstock as Trinidad and Tobago’s gas reserves dwindle.
Effective liquefaction Capacity vs LNG demand by region

COUNTRY ANALYSIS
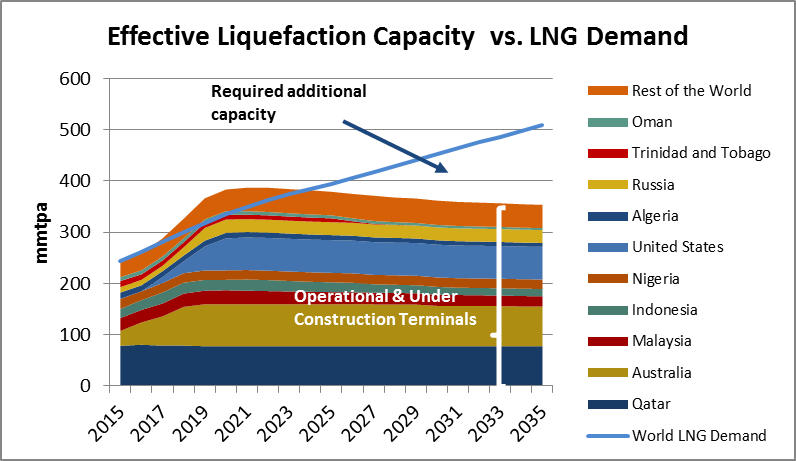
- The significant increase in effective liquefaction capacity to 2020-21 is led by a strong growth in Australia and the United States until 2019 and 2021 respectively (based on existing facilities and projects under construction, potential projects are not included).
- After 2021, unless new projects are launched, gradual decline in production capacity due to the ageing of some facilities (SouthEast Asia) and growing constraints on resources (Trinidad & Tobago, UAE, Oman Algeria, Indonesia and Malaysia) is to be expected.
- CEDIGAZ expects a strong penetration of US projects, from 2017, accelerating thereafter to reach 64 mmtpa in 2021, or 16% share of liquefaction in the world.
- Effective capacity in the “Rest of the World” is also expected to increase, mainly due to the resumption of production in Angola in 2017, new production in Mozambique (Coral FLNG) and the probable development of Fortuna FLNG in Equatorial Guinea. Currently idle (or mostly idle) capacity in Egypt and Yemen could resume production during the projection period and bring additional volumes to the market.
Effective liquefaction Capacity vs LNG demand rest of the world

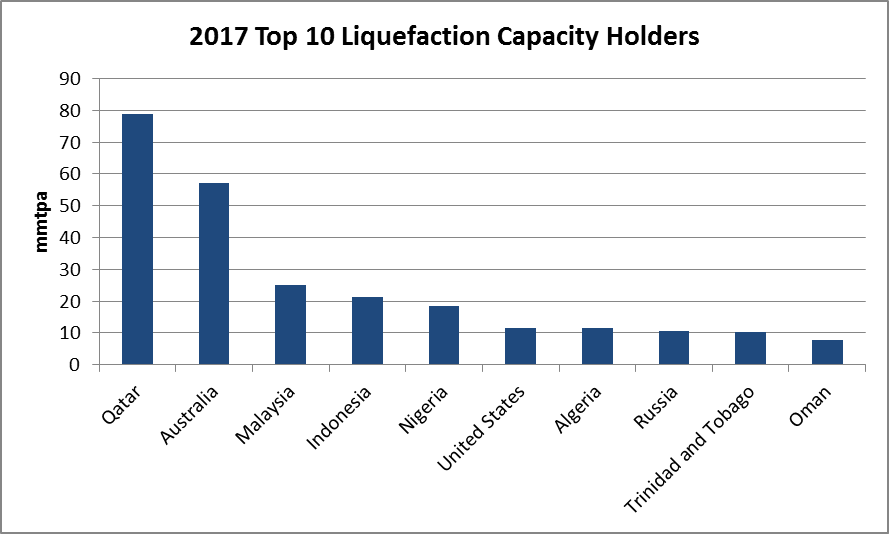
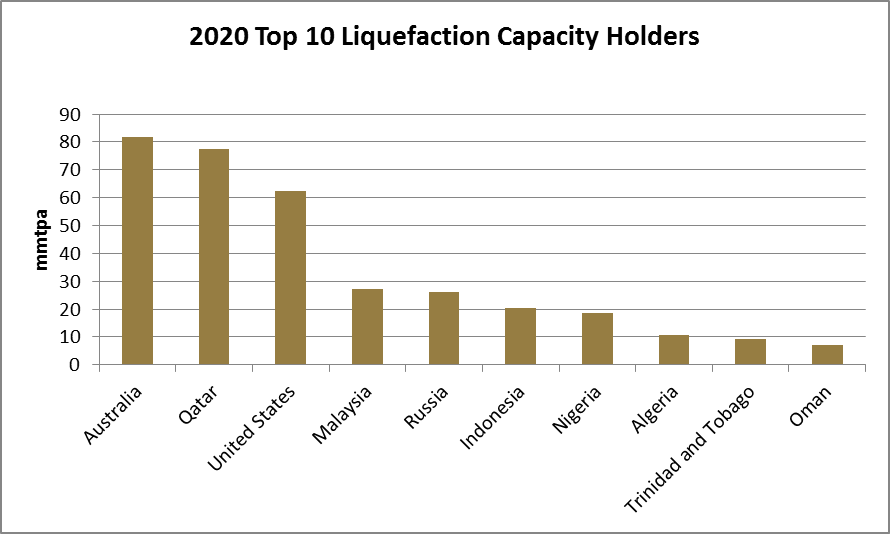
The ramping up of Australian and US projects will upset the hierarchy among LNG producers as soon as 2020, with Australia overtaking Qatar to become the number one capacity holder, and the US, an insignificant producer before 2016, moving up to the third rank, ahead of Malaysia.
2017 Top 10 liquefaction Capacity Holders
2020 Top 10 liquefaction Capacity Holders
 Based on Cedigaz supply/demand estimates, new projects will need to come online post 2023/2024 to accommodate rising LNG demand. Cedigaz expects that the strongest increases in LNG capacity from post-FID projects will originate from the US, Canada, Mozambique and Qatar.
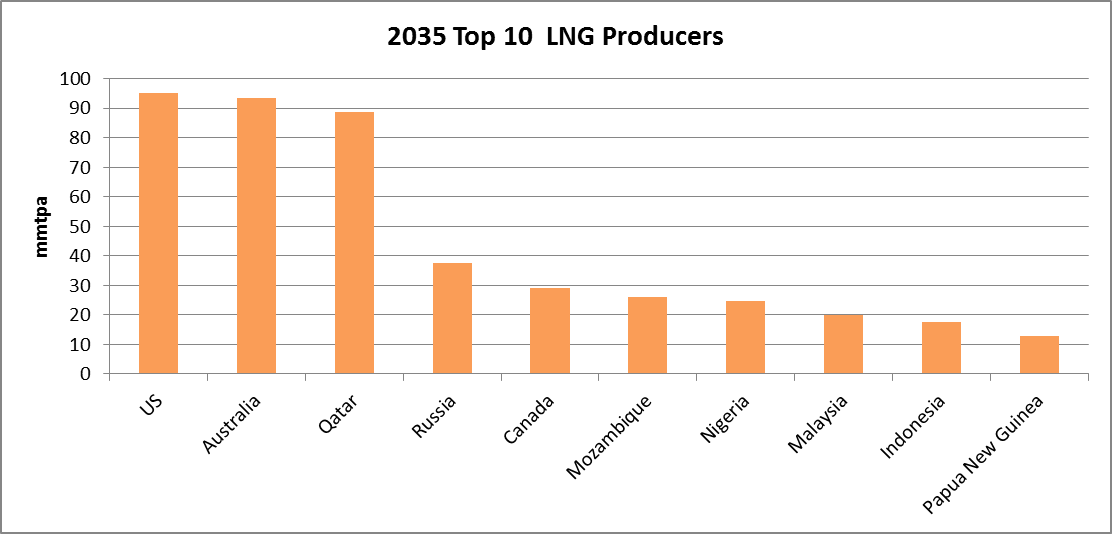
In this scenario, US would become the number one LNG producer before Australia and Qatar by 2035 with a market share of 19%. Russia would move up to the fourth place thanks to new projects on top of Yamal. Canada, Mozambique and Papua New Guinea would make their way into the top-10 while Algeria, Trinidad and Tobago and Oman would exit it.
2035 Top 10 LNG Producers
CAPACITY vs. OUTPUT
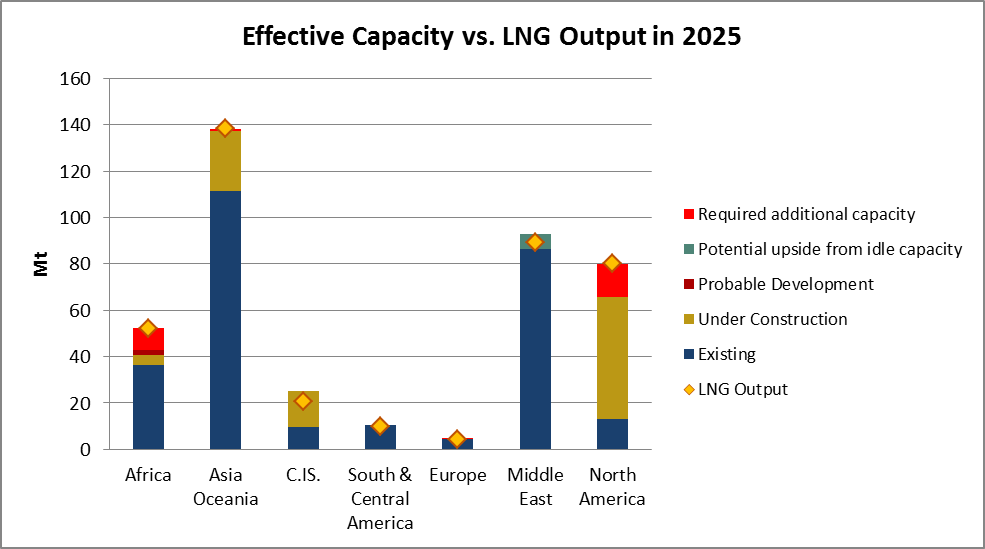
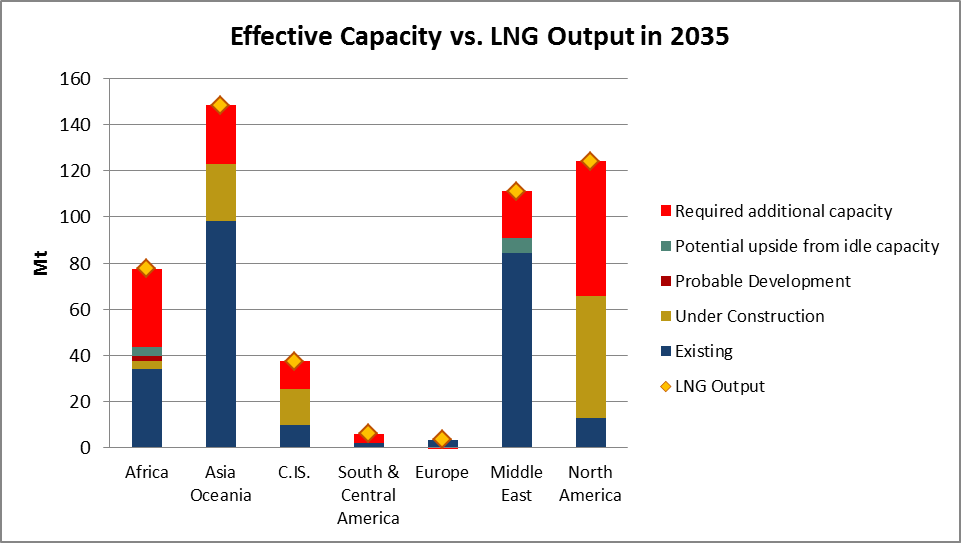
- Comparing the effective capacities, based on projects existing or sanctioned, to the estimated LNG production in 2025 and 2035 in Cedigaz’s scenario, allows an estimation of the additional capacity that will need to be sanctioned on a regional basis
- In 2025, two regions – Africa and North America- present a deficit of effective capacity, i.e. capacity from existing facilities and projects under construction is lower than projected, LNG output.
- By 2035, new liquefaction projects will be required in all regions.
Effective Capacity vs LNG Output in 2025

Effective Capacity vs LNG Output in 2035

ASIAN LNG TRENDS BY COUNTRY
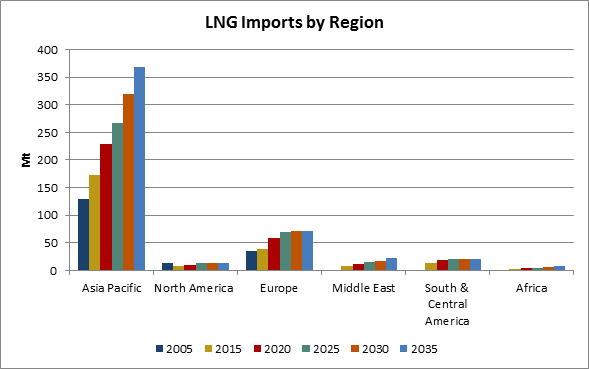
- Asia global imports are projected to more than double between 2015 and 2035, growing from 173 mmtpa to 368 mmtpa, 3.8% average annual rate. The traditional markets (Japan, South Korea and Taiwan) will remain stable, while emerging markets (such as China, India, Malaysia, Pakistan, Singapore and Thailand) are expected to grow significantly: their imports will rise from 41 mmtpa in 2015 to 193 mmtpa in 2035. New Asian markets – Bangladesh, Indonesia, the Philippines and Vietnam – will also contribute to the increase of imports from the 2020s, reaching almost 40 mmtpa in 2035. Asia will maintain its position as the leading LNG import region with a market share of around 70% throughout the projection period.
LNG Imports in Asia
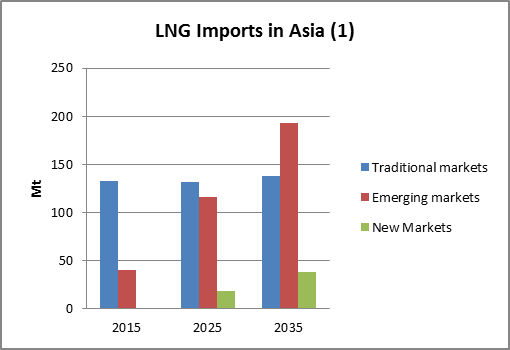
LNG Imports in Asia (1)
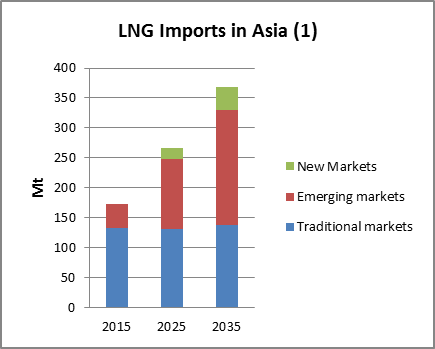
(1):Traditional markets: Japan, South Korea, Taiwan Emerging Markets: China, India, Malaysia, Pakistan, Singapore, Thailand New Markets: Bangladesh, Indonesia, Philippines, Vietnam
LNG imports by region
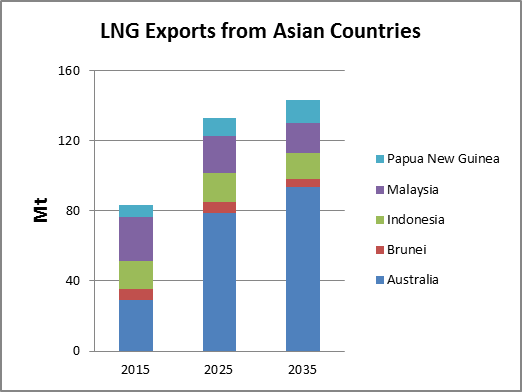
LNG Exports from Asian Countries
For more information: contact@cedigaz.org
Our website: https://www.cedigaz.org/
Cedigaz (International Center for Natural Gas Information) is an international association with around 80 members worldwide, created in 1961 by a group of international gas companies and the Institut Français du Pétrole Energies nouvelles (IFPEN). Dedicated to natural gas information, CEDIGAZ collects and analyses worldwide economic information on natural gas, LNG and unconventional gas in an exhaustive and critical way.
[1] Effective capacity based on existing facilities and projects under construction only.