The LNG market grew strongly in 2019. Global Imports (net of re-exports and domestic shipment, Fig_1&2) were up by 12.2% to reach 350.5 Mt (+38 Mt Y-o-Y) driven by the arrival of abundant LNG supply. In a context of weak growth in Asia (+5 Mt Y-O-Y compared to +27 Mt Y-o-Y in 2018) , which had been the driving force in previous years, Europe absorbed the bulk of the new volumes (+37 Mt), acting as a market of last resort. In all other regions, combined net imports’ decline was -4 Mt (Includes -2.3 Mt from Egypt in North Africa as it ceased LNG imports). As the growth in LNG supply outpaced demand, prices plummeted, reinforcing the competitiveness of gas in Europe.
Figure_1: Monthly Evolution of LNG Trade Y-O-Y (Mt)
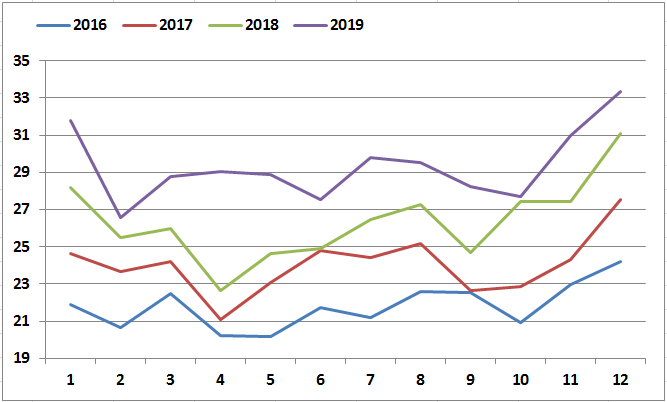
Source: Cedigaz
This global slowdown in LNG demand outside Europe mainly came from OECD Asia, which was unable to absorb the additional supply of LNG which flooded the market. The growth in Asia slowed as net imports in stalwart markets like Japan (-5.6 Mt ) & South Korea (-3.5 Mt) declined, while in China, net imports growth slowed from 41% (+15.7 Mt) in the year 2018 to 14% (+7.4 Mt) in 2019. Chinese net LNG imports exceeded that of Japan for the first time in November and again for a second time in December. Other countries recording a growth in LNG imports in Asia were Bangladesh (+3.3 Mt Y-o-Y), Pakistan (+1.3 Mt Y-o-Y) and Malaysia (+1.4 Mt Y-o-Y).
In China, the apparent gas demand increased by 9% in 2019 to nearly 305 bcm as net LNG imports grew by 14% to 61.3 Mt and domestic production increased, especially in the southwestern province of Sichuan. This increase in domestic output diminished the need for gas imports affecting pipeline gas which fell -1.2% in the first 11 months. Additionally, the relaxation of China’s clean air policies including coal-to-gas switching further contributed to sluggish LNG imports growth. The industrial activity has also remained weak over the year, impacting demand. The share of Australia in China’s LNG imports increased by 2% Y-o-Y to 46% , representing a volume of 28 Mt.
In South Korea, the LNG demand fell due to subdued economic growth, mild weather and sluggish city gas demand. Some major nuclear reactors restarted after being shut for maintenance and safety checks resulting in an increased nuclear power output in 2019 (+2%). This seemed to have impacted LNG demand for power generation as gas power output fell by 3%. Additionally, the government raised the city gas prices by 4.5% in July 2019, which resulted in sluggish domestic and industrial gas demand. The reduction in LNG supply came largely from Qatar, from which LNG deliveries fell by 4% (- 3.1 Mt) to 11.2 Mt. In India, the net LNG imports were nearly flat at 22Mt and domestic gas production declined by nearly 2% Y-o-Y. Also, the country’s economic growth fell to 5% (-2% Y-O-Y) which resulted in depressed demand across industries including the gas sector.
Figure_2: Top LNG (net) Importers (Mt)
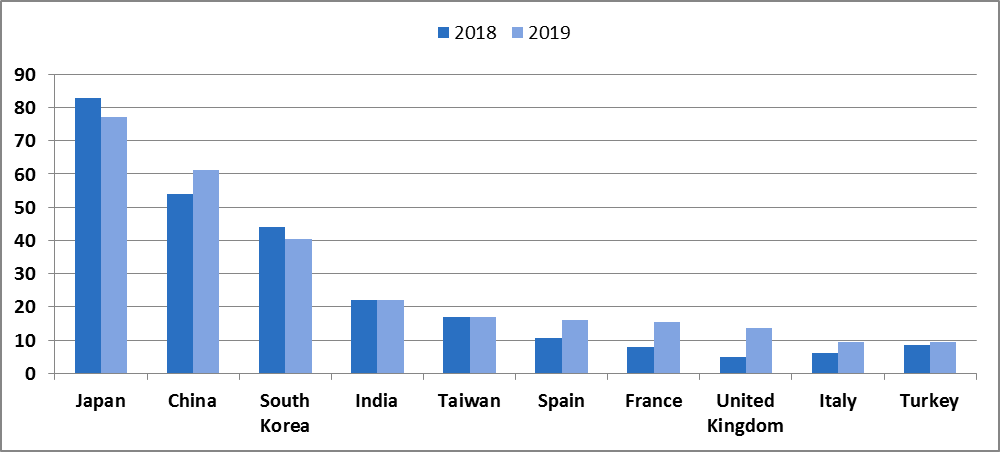
Source: Cedigaz
In Japan, the slump in LNG demand resulted from the decline in gas fired power generation as five nuclear reactors restarted and also from the increased generation of solar power. Half of the net Imports decline (-5.6 Mt) in Japan came from the UAE, who reduced exports to Japan by 57% (-2.8 Mt).
European became a market of last resort for the suppliers who traded an additional +38 Mt of LNG in the market at a time when the Asian LNG demand growth was sluggish. This weak demand, coupled with lower LNG spot prices in Asia resulted in the diversion of destination flexible LNG cargoes to Europe. As a result, net LNG imports in the region increased steeply by 76% to nearly 86 Mt (+37 Mt Y-O-Y). This surge in LNG imports combined with higher inventories impacted the European spot natural gas prices, which fell to decade-lows. Lower natural gas prices provided incentives to power producers which resorted to coal-to-gas switching as seen in countries like Spain and Germany. In Spain, where net LNG imports increased by +5.3 Mt, power output from coal declined by 70% (- 796 Gwh/d). This decline was compensated by the gas power output, which increased strongly by nearly 100% (+812 Gwh/d). Outside Spain, net LNG import growth was particularly strong in the UK (+8.8 Mt) and France (+7.5 Mt). 75% (+27.4 Mt) of the incremental LNG supply to Europe was fulfilled by Russia (+11 Mt), the US (+10 Mt) and Qatar (+7.4Mt).
In all other regions, net Imports declined. In Latin America, imports were down marginally by 3%(- 0.3 Mt Y-O-Y), while in North America and Middle East, net imports declined by 8% (-0.7 Mt Y-O-Y) and 10% (-0.6 Mt Y-O-Y) respectively.
Figure_3: Top LNG Exporters (Mt)
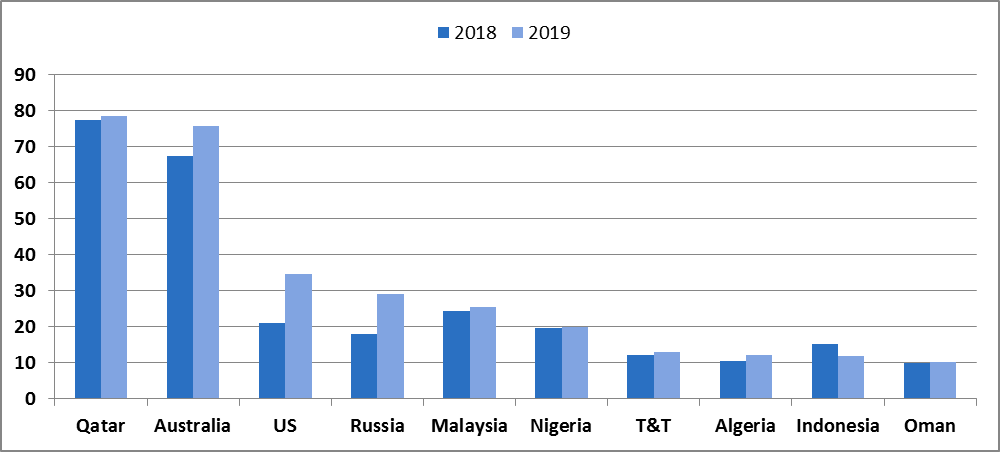
Source: Cedigaz
Global supply growth (Fig_3) was driven by the US, Russia and Australia, where exports increased by almost +13.6 Mt, +11 Mt and +8.4 Mt respectively. Europe absorbed 78% of the increased supply from the US and nearly all (98%) of the additional supply from Russia. In the US, increased supply was boosted by the commercial startup of the Elba Island LNG, Freeport LNG, Cameron LNG, Corpus Christi and Freeport LNG while in Russia, exports from Yamal LNG ramped up. In Australia, production ramped up from Train 1&2 of Ichthys LNG and Train 2 of Wheatstone LNG.
Figure_4: Monthly Evolution of Prices ($/mmbtu)
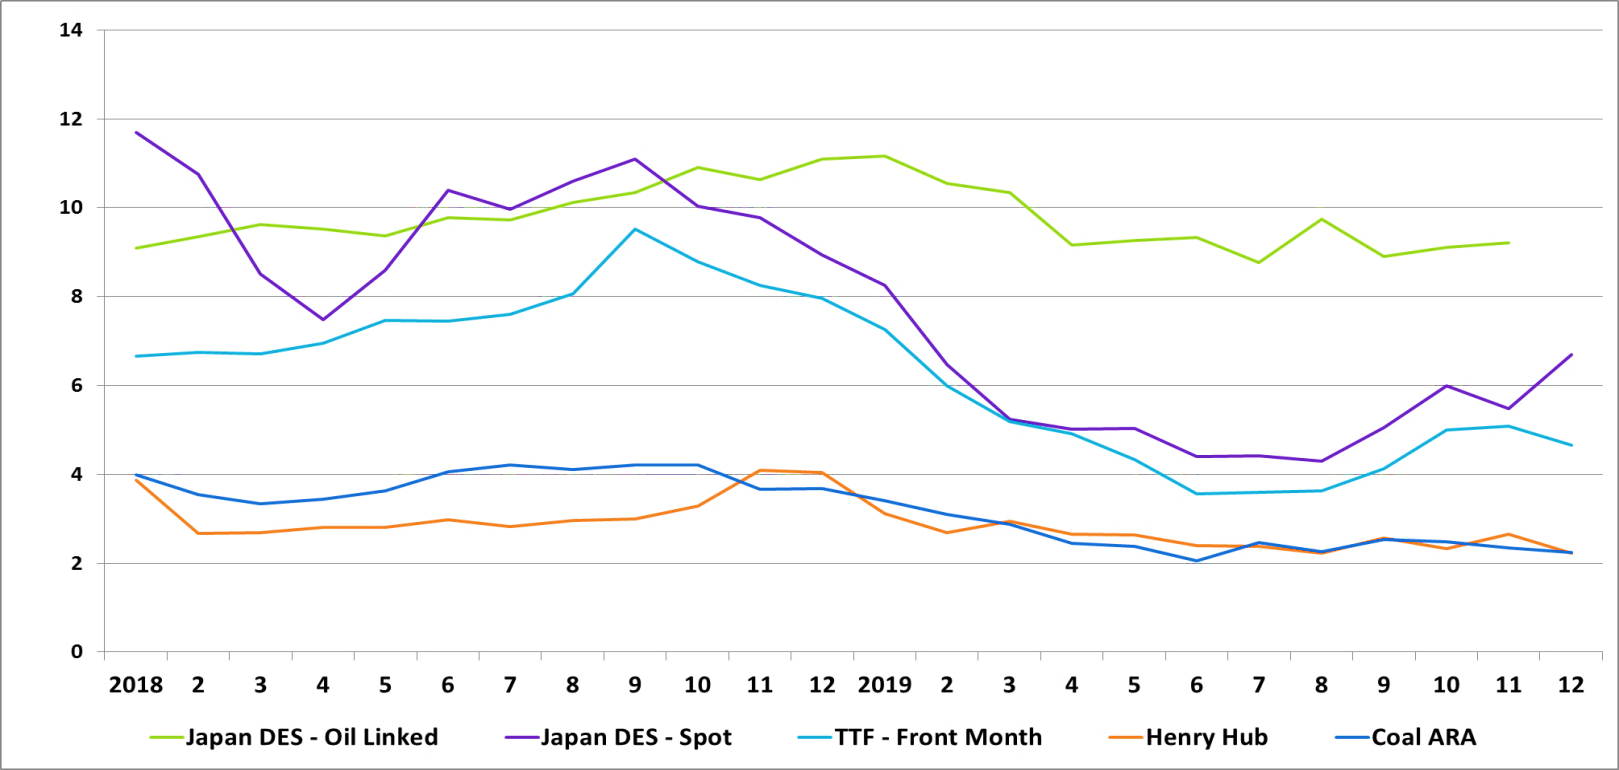
Source: CEDIGAZ/ARGUS/METI/EIA
Global gas and LNG prices (Fig_4) remained depressed throughout 2019 due to strong global supply growth and weak Asian LNG demand. In Europe, TTF front month prices declined to a 10 year low of nearly $3.2/mmbtu in June 2019 and in North East Asia, spot prices averaged nearly $6/mmbtu in Q4 2019, the lowest level for Q4 in a decade. The spread between European gas hubs and the Asian spot remained less than $1/mmbtu for most part of the year, and Europe’s LNG re-exports fell by 37% (-1.4 Mt Y-o-Y) to 2.3 Mt in 2019. The price of coal, which is an important parameter for coal-to-gas switching fell by 34% during the year. However, the TTF front month prices fell by 36% during the year, making natural gas competitive versus coal in Europe.
Amit Rao – Economist – CEDIGAZ