The CEDIGAZ LNG brief is based on CEDIGAZ’ monthly LNG trade database. It is published on the blog 3 months after its disclosure to CEDIGAZ members.
LNG in H1 2019
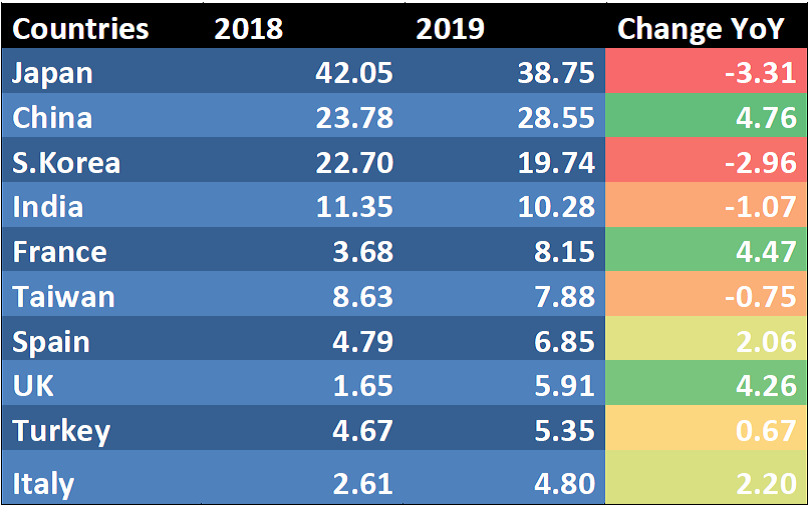
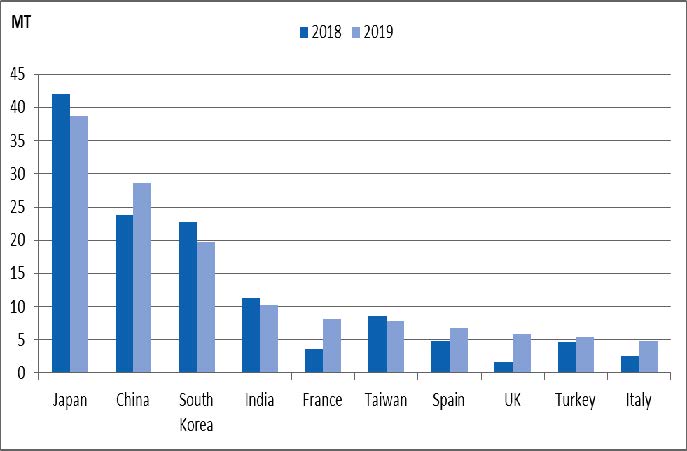
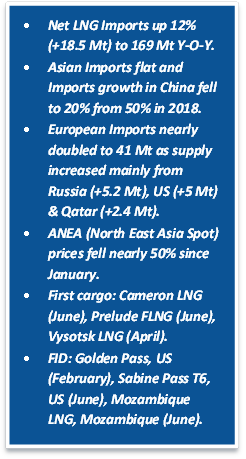 Global Imports (net of re-exports) grew by 12% in H1 2019 to reach 169 Mt (+18.5 Mt Y-o-Y) driven by the surge of European imports. Asian demand was insufficient to absorb the sharp supply rise. Overall demand in Asia remained almost flat as strong growth in China (+4.7 Mt) and Bangladesh (+1.6 Mt) was offset by declines in Japan (3.3 Mt) and South Korea (3 Mt).
Imports growth in China declined from nearly 50% in 2018 (H1) to 20% on account of increased domestic gas production (+10%), higher pipeline imports and weaker demand growth due to a mild winter (vs H1 2018) and policy easing on enforcement of coal-to-gas conversions.
In Japan, nuclear output has increased and, inventories were high after a mild winter. Nuclear output in Korea grew by 36%, affecting gas demand as gas-fired electricity generation dropped by 11%.
In the absence of a strong North Asian demand growth, Europe acted as the market of last resort. Net imports in the region almost doubled to 41 Mt (+19 Mt Y-O-Y). Growth was particularly strong in the UK (+4.2 Mt) and France (+4.4 Mt). In Latin America, imports were up by +17% (+0.8 Mt), conversely they declined in North America and MENA.
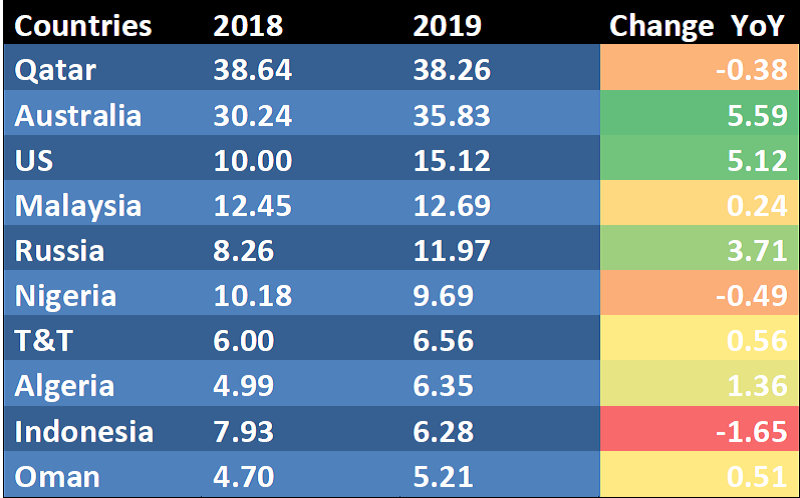
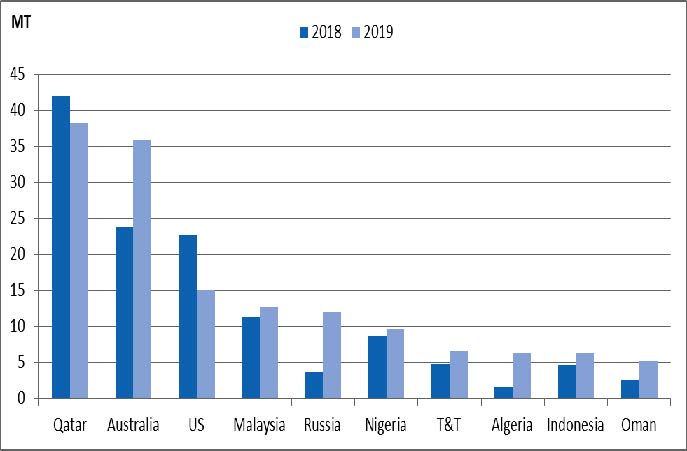
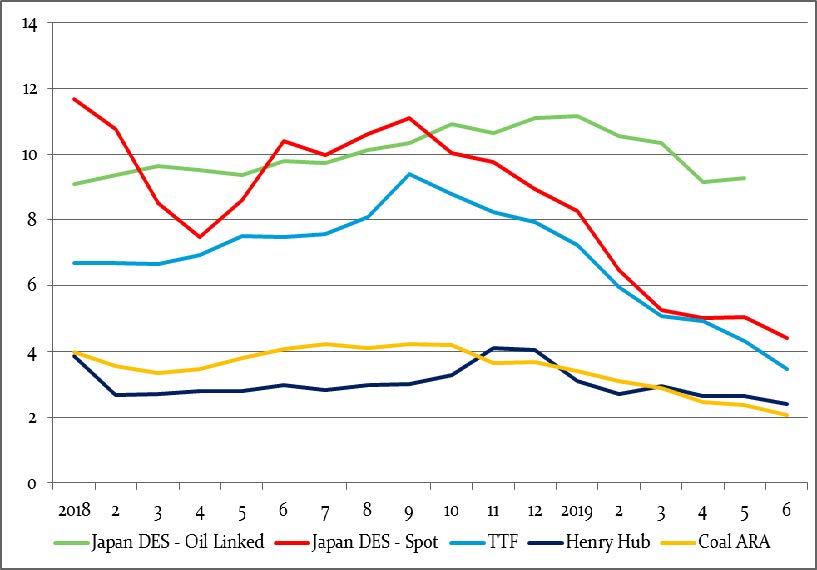
Global supply growth was driven by Australia, the US and Russia where exports increased by almost 5.6 Mt, 5.1 Mt and 3.7 Mt respectively, boosted by the ramp up of Train 1&2 of Ichthys LNG and Train 2 of Wheatstone in Australia, Train 1 of Cove Point and Corpus Christi in the US and Train 2&3 of Yamal in Russia. Strong global supply growth and weak NEA LNG demand contributed to the rapid decline in spot prices. NEA spot prices, almost halved since January, stimulating European imports. Average monthly spot prices for June were $3.5 mmbtu (TTF) in Europe and $4.4/mmbtu in North East Asia, putting pressure on the US LNG off takers (the estimated short run marginal cost of US LNG in June was around $3.3/mmbtu to Europe and $4.5/mmbtu to Asia).
The spreads between European gas hubs and the Asian spot market remained low this year, reducing Europe’s re-exports by 21% (0.3 Mt Y-o-Y) to 1.2 Mt. The lower prices have not yet triggered additional demand in Asia and with further new supply scheduled to come online in the months ahead, the pressure on global gas prices should contin-ue to mount.
|
Table_1: List of Top Net LNG Importers (Mt)
|
Table_2: List of Top LNG Exporters (Mt)
|
|
Figure_1: Top LNG (net) Importers
|
Figure_2: Top LNG Exporters
|
|
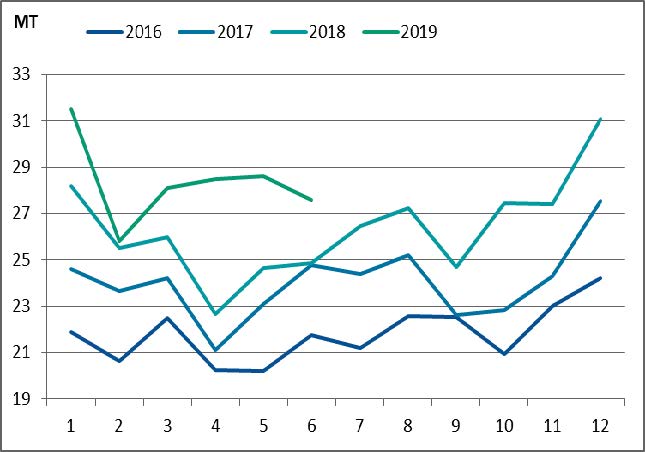
Figure_3: Monthly Evolution of LNG Trade Y-O-Y
|
Figure_4: Monthly Evolution of Prices ($/mmbtu)
|
Amit Rao – Economist – CEDIGAZ