This blog post analyses the main findings of the LNG Monthly Bulletin. The LNG Monthly Bulletin provides monthly traded volumes and prices by importer and country of origin, it is part of the LNG Service by Cedigaz.
Asian LNG market is easing
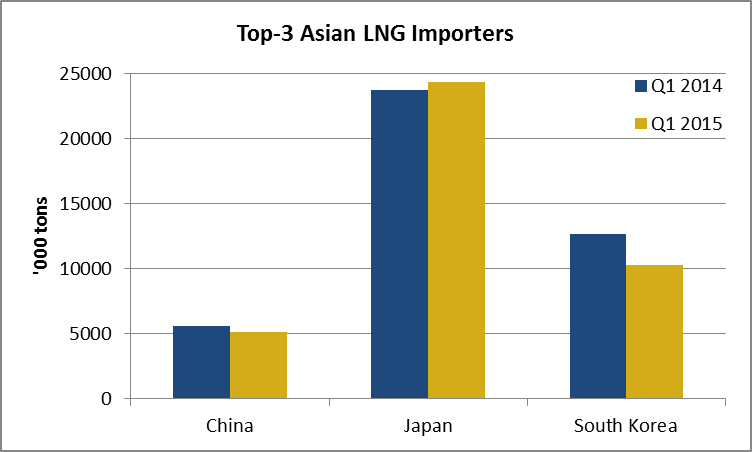 In Asia, LNG purchases of the regional top-3 buyers (Japan, South Korea and China) decreased by 5.5% year-on-year in the first quarter of 2015. Imports fell from 42 million tons to 39.7 million tons, pulled by a 19% drop in South Korea (-2.4 million tons) where higher inventories and another mild winter pushed imports down. Lower demand for natural gas was highlighted by the drop in KOGAS’ domestic sales (-7.6%), mainly due to a fall in sales to the power sector (-14.3%).
In China, imports declined by 8.6% from 5.6 million tons to 5.1 million tons while in Japan, LNG purchases grew slightly from 23.7 million tons in Q1 2014 to 24.3 million tons in Q1 2015, even though mild temperatures cut total power demand.
February was a contrasted month in Europe
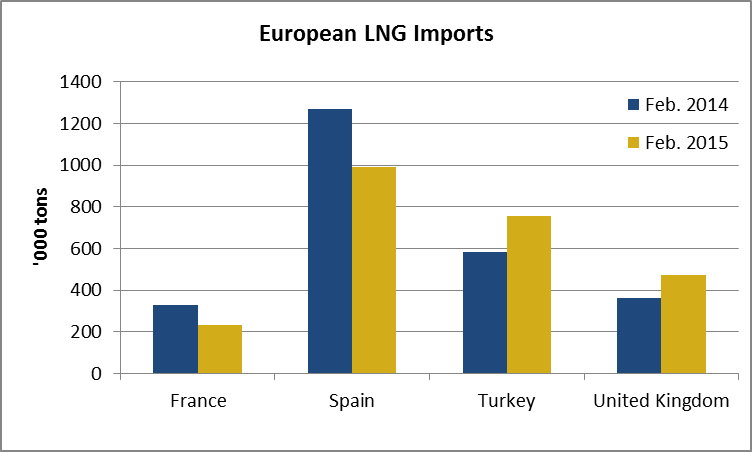 In February 2015, European imports reached 3.2 million tons which is lower than purchases of January but equal to February 2014’s level. European demand for LNG was mostly driven by Turkey and the United Kingdom: in both countries, imports grew by 30% year-on-year. Turkey imported 0.75 million tons from Algeria, Nigeria and Qatar while the United Kingdom imported 0.47 million tons from Norway and Qatar. As a consequence of converging European and Asian spot prices, Qatar increased its deliveries of flexible LNG to Europe. While customs data show exports from Qatar at seasonal levels in the United Kingdom, Qatari LNG flows increased to Belgium (+67.4% YoY to 0.31 million tons) and to Turkey (+50.2% YoY to 0.4 million tons) in February.
In France, imports fell by 29% year-on-year to 0.23 million tons in February. In Spain, LNG purchases dropped by 22% from 1.27 million tons in February 2014 to 0.99 million tons in February 2015. However, LNG net imports decreased by 8% only year-on-year as the country did not re-export LNG while it shipped three cargoes a year before (including two to Brazil and one to Japan). Despite lower net pipeline imports (13.3 TWh against 17.7 TWh), net gas supply was almost stable in February 2015 at 30.9 TWh (against 29.5 TWh in February 2014) thanks to higher storage withdrawals (4.9 TWh).
US and Canadian LNG imports rebounded in February
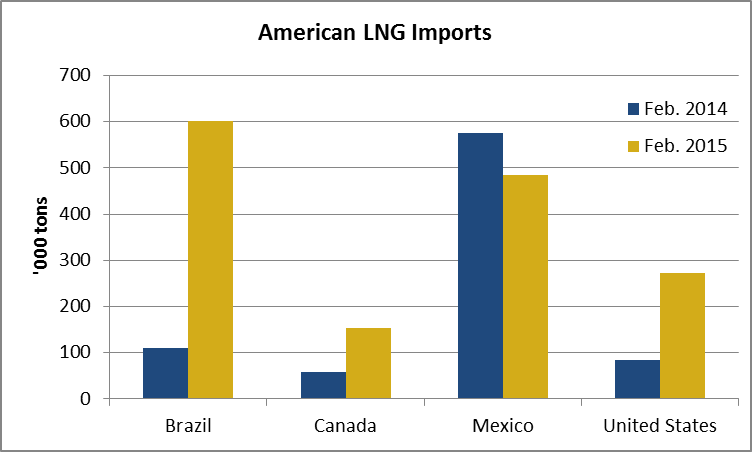 In the United States, LNG imports grew very slightly from 0.26 to 0.27 million tons from January to February but were much higher year-on-year as the country imported only 0.09 million tons in February 2014. Canadian imports increased significantly and were three times higher than the year before. The country imported 3 cargoes in February from Trinidad and Tobago, equivalent to the total volume of imports of the previous six months.
In Brazil, LNG imports confirm their sustained growth, as they reached 0.56 million tons in April. This is 36% higher than the volumes of March and 18% higher than in April 2014.
by Louis Jordan, Junior Economist, Cedigaz