CEDIGAZ Gas Data
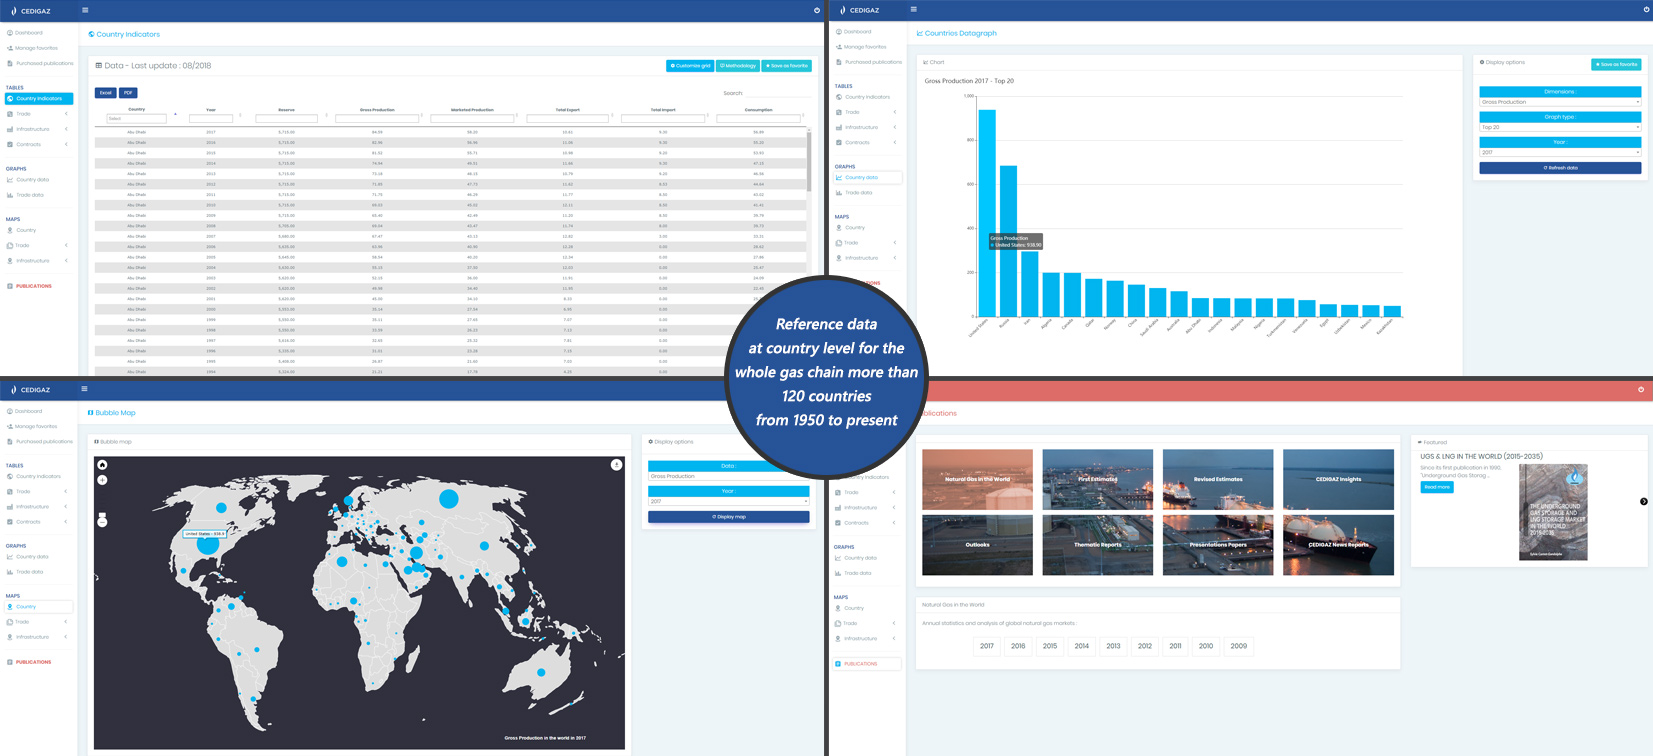
CEDIGAZ Natural Gas Statistical Databases cover the whole gas chain worldwide from reserves to consumption, including trade, main infrastructure (LNG import and export terminals, Underground Gas Storage facilities) and gas supply contracts. Tracking developments in the gas industry and the energy sector, CEDIGAZ is also developing databases on biomethane and hydrogen. Established in 1961, CEDIGAZ is probably the oldest provider of global, fundamental natural gas data and its databases have the longest track record on the market. Mainly based on official data and covering more than 120 countries, CEDIGAZ data are recognized for their reliability and used as a primary source by the main international and national references in the field of energy, such as the International Energy Agency, the BP Statistical Review, the Energy Information Administration, the OPEC, the Gas Exporting Countries Forum and many more.
Designed for gas professionals with little time on hands, CEDIGAZ databases allow to dig into detailed and accurate data on natural gas in the world.
Advanced browsing and reporting features help focus on what is important for business research. Data visualization with graphs and charts, standard or customized reports contribute to a better understanding of the market situation. And it can be easily shared with teams thanks to Excel exports.