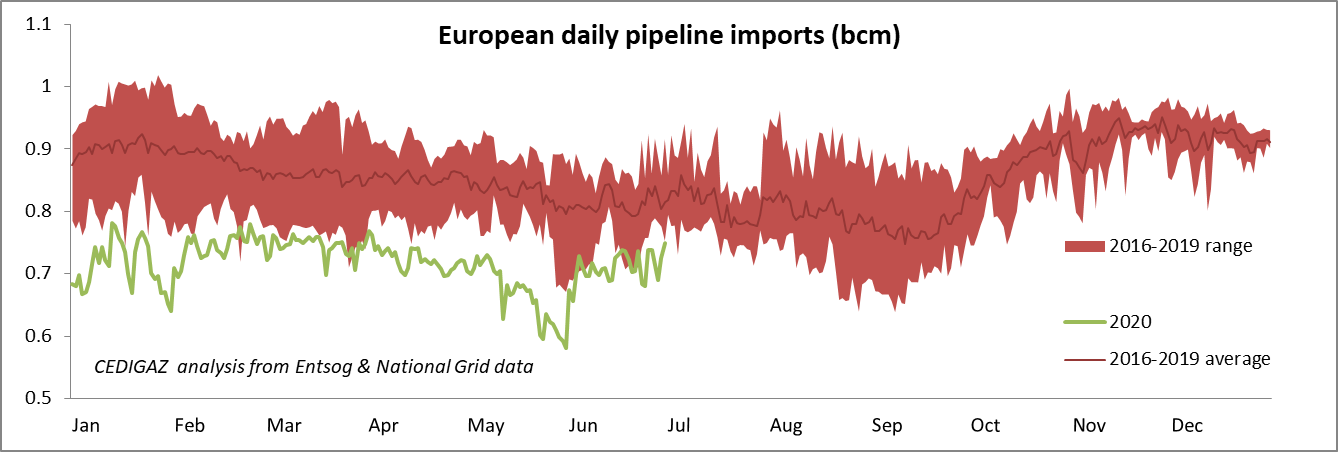
European[1] gas imports by pipeline were relatively stable in H1 2020 but down 19% year on year
Monthly pipeline gas flows to Europe were surprisingly quite stable in the first half of 2020, with a minimum estimated at 20.6 bcm in May against a maximum 23.1 bcm in March. However compared to last year, pipeline imports were down by 18% in the first quarter and 20% in the second quarter. Overall, European pipeline imports stood at 130 bcm in the first semester of 2020, an estimated 30 bcm (-19%) decline compared to the same period last year. Remarkably, daily flows remained below the minimum recorded in the 2016-2019 period on almost every day of the semester.
Spot indexed Norwegian gas was less affected
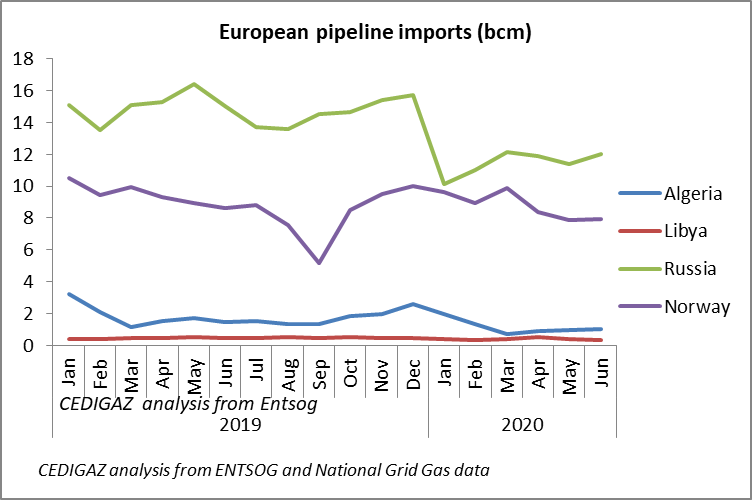
Russia bears the brunt (72%) of the year-on-year decrease in terms of volume with a 21.8 bcm decline in the first semester, followed by Algeria (-4.2 bcm), Norway (-4.1 bcm) and Libya (-0.4 bcm). In relative terms, Algeria was hit the hardest with a 38% contraction of its pipeline exports to Europe, against a 24% drop for Russia, 16% for Libya and just 7% for Norway. This seems coherent with the fact that Norwegian long-term contracts are largely spot indexed (with little volume flexibility) which is less the case for Russian and Algerian contracts. As prices plummeted to levels unseen before, buyers turned to spot index sources such as LNG and Norwegian gas, making use of the volume flexibility embedded in long-term oil index contracts. However it is very likely that Russian and Algerian shipments stood below buyers’ contractual obligations in the first semester suggesting a possible increase in imports from those countries in the second half of the year.
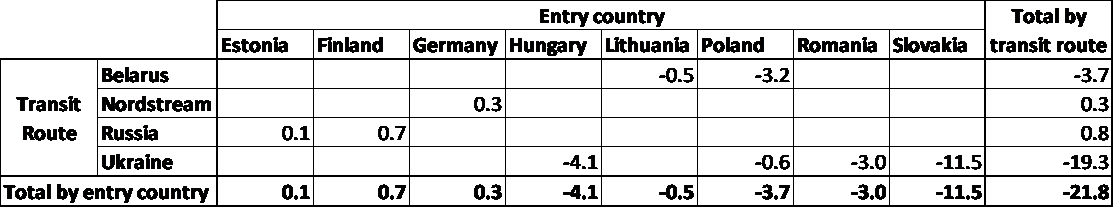
Russian flows through Ukraine declined the most
The drop occurred mainly between December 2019 and January 2020 and was due to the sudden curtailment of the Russian flows through Ukraine that declined by more than 80% overnight between December 31 and January 1, in a swift implementation of the last minute deal between the two countries. Volumes have slightly recovered since then but remained 50% down year on year in the first semester of this year (-19 bcm). Entry flows to Slovakia alone declined by 11.5 bcm (-41%) while imports through Romania recorded the highest relative decline (-93%).
Russian flows through Ukraine were estimated at 21 bcm for the entire six-month period, 35% less than the average flow needed to reach the 65 bcm Russia has agreed to ship through Ukraine this year. This points to a possible growth of Russian flows through this route in the second semester if Russia is to uphold its part of the deal.
Other imports routes were less affected: shipments through Belarus were down 18% (- 3.7 bcm) while Nordstream was used at full capacity with volumes slightly up (+1.1%).
Year-on-year changes in Russian imports by transit route and country of entry in H1 (bcm)
CEDIGAZ analysis from ENTSOG data
[1] Excluding Turkey (no flow data available) but including non-EU countries (Bosnia and Herzegovina, Macedonia, Serbia, Switzerland, United Kingdom)
Geoffroy Hureau
CEDIGAZ