After a 1.5% decline in 2022, marked by the gas supply crisis caused by the Russia-Ukraine war, global natural gas consumption recovered slightly in 2023, with an estimated growth rate of 0.6%. The Russian gas crisis has led to tense market conditions as global LNG supply growth was too limited to compensate for the cut of Russian gas supplies to Europe. However, a number of economic, technological and weather factors eased the market and tempered the pressure on both demand and prices in 2023. Europe stands out with a very steep decline in demand to its lowest level since 1995. Driven by this steep reduction in natural gas demand and record-high gas storage levels, European gas prices fell considerably while remaining highly volatile. Asian spot LNG prices followed a similar trajectory. The global market experienced a gradual rebalancing throughout 2023 and natural gas storages closed the year at or near the top of the five-year range in all three key regions (North America, Europe and Northeast Asia).
Global gas consumption posted a modest 0.6% increase
After a 1.5% decline in 2022 in the context of trade disruption caused by the Russian invasion of Ukraine, global natural gas consumption recovered slightly in 2023, posting a 0.6% annual growth representing an incremental volume of 23 bcm. This recovery was not strong enough to compensate for the losses seen in 2022, so that global gas demand remained below the 2021 level in 2023.
Several factors weighed on the demand and limited its global recovery:
– Abrupt decline of gas-fired power generation, phased out by renewables and strong nuclear generation (France, Japan & South Korea)
– Extreme mild weather conditions which weighed both on electricity and gas demand for buildings, as 2023 witnessed the highest global temperatures on record.
– Economic difficulties and high prices continuing to cause demand destruction in Europe.
– Modest economic recovery in China (weakness of gas demand for industry).
– Energy savings, especially in Europe
Europe stands out with a very steep decline in demand to its lowest level since 1995. Indeed, in Europe (UK, Turkey and Balkans included), natural gas consumption fell 7.4% to 444 bcm in 2023 ( – 36 bcm). In the EU27, natural gas consumption was down 7.8% to 322 bcm. The sharp reduction in natural gas demand in Europe was offset by relatively strong growth in the Middle East and Asia-Oceania, and to a lesser extent, in the United States. In Asia, China’s domestic gas demand rebounded by 8% to 386 bcm. The fastest-growing consuming sectors were the residential, service and industry, followed by gas-fired power generation and transport.
Global marketed gas production increased marginally by 0.5% in 2023
In 2023, global marketed production increased marginally by 0.5% to reach 4090 bcm in 2023, corresponding to a limited additional volume of 19 bcm. This growth was driven by significant contributions from North America, which added 51 bcm, under the impulsion of the United States. Other regions experiencing growth included the Middle East (+16 bcm) and Asia-Oceania (+5 bcm). However, these gains were largely offset by notable declines elsewhere. Russian production fell sharply for the second consecutive year, dropping by 35 bcm. Europe and Central and South America also recorded decreases, of 17 bcm and 5 bcm, respectively.
At the regional level, North America increased its market share from 30% in 2022 to 31% in 2023, while the CIS saw its market share decline again from 21% to 20%, followed by the Middle East (18%), Asia-Oceania (17%), Africa (6%), Europe (4%) and South & Central America (4%). As regards economic zones, the OECD countries saw their share of global production rise slightly to 41%.
Figure 1: Marketed gas production by region
(bcm)
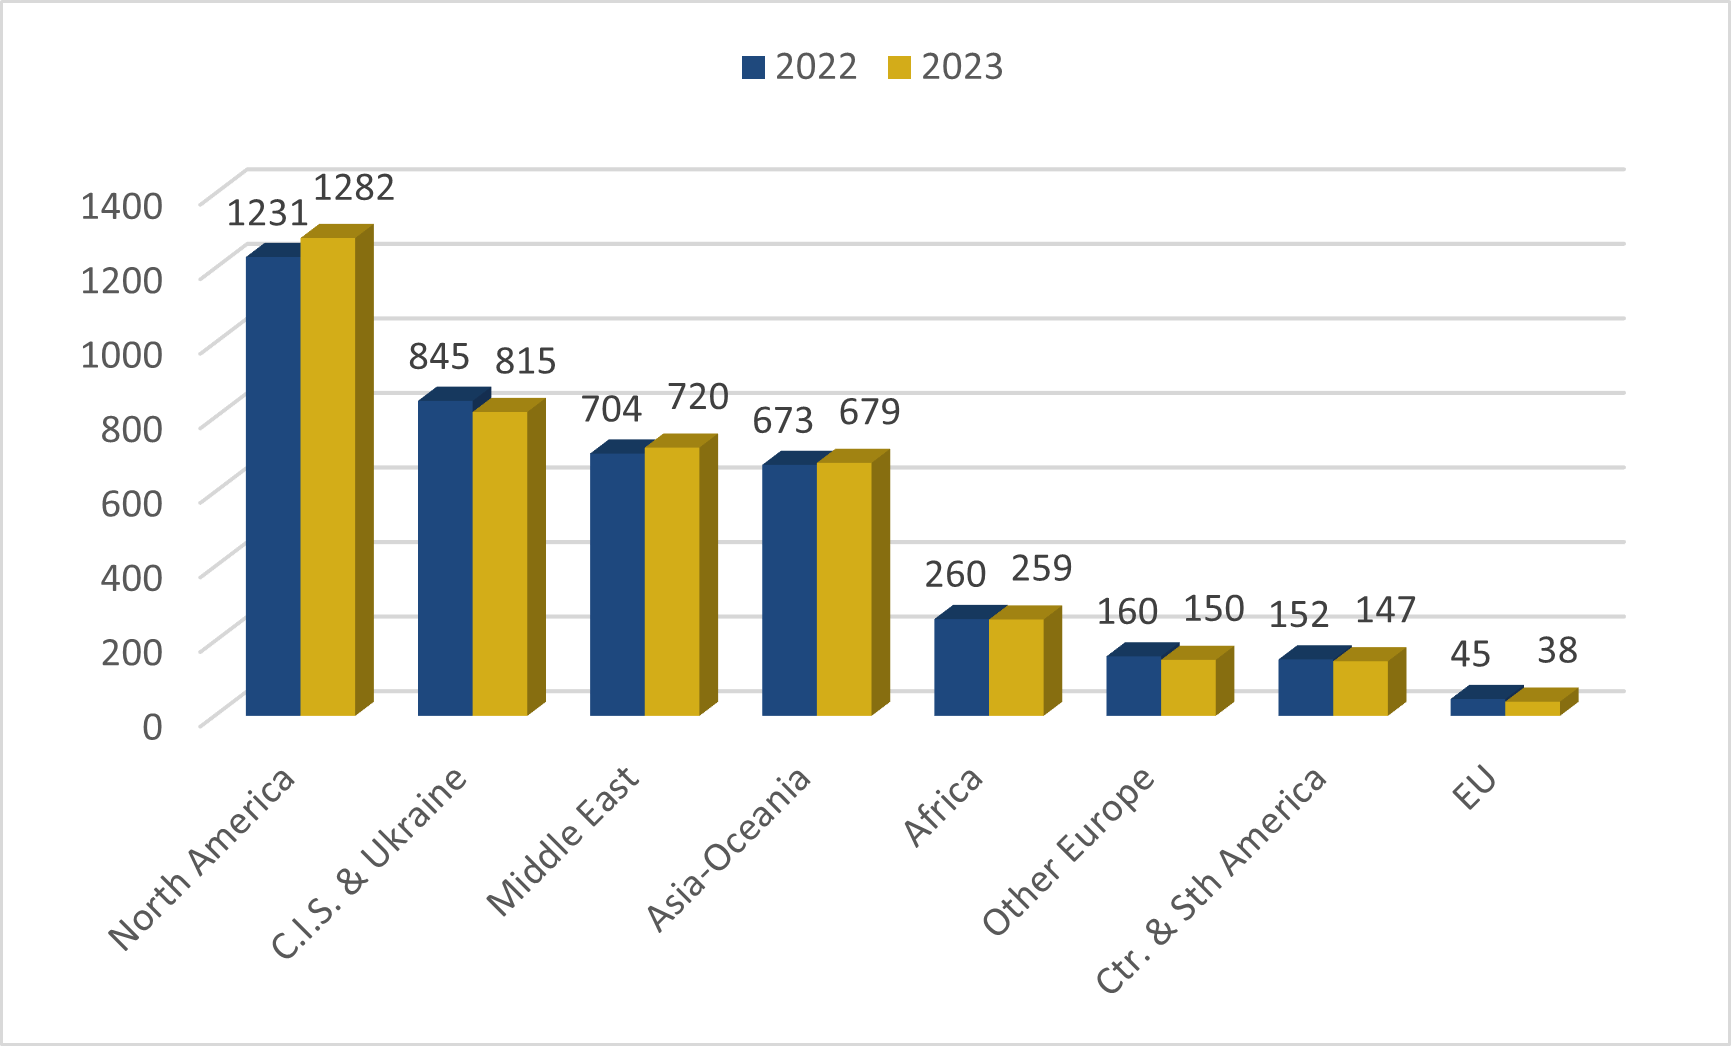
Source: Cedigaz
Figure 2: Natural gas consumption by region
(bcm)
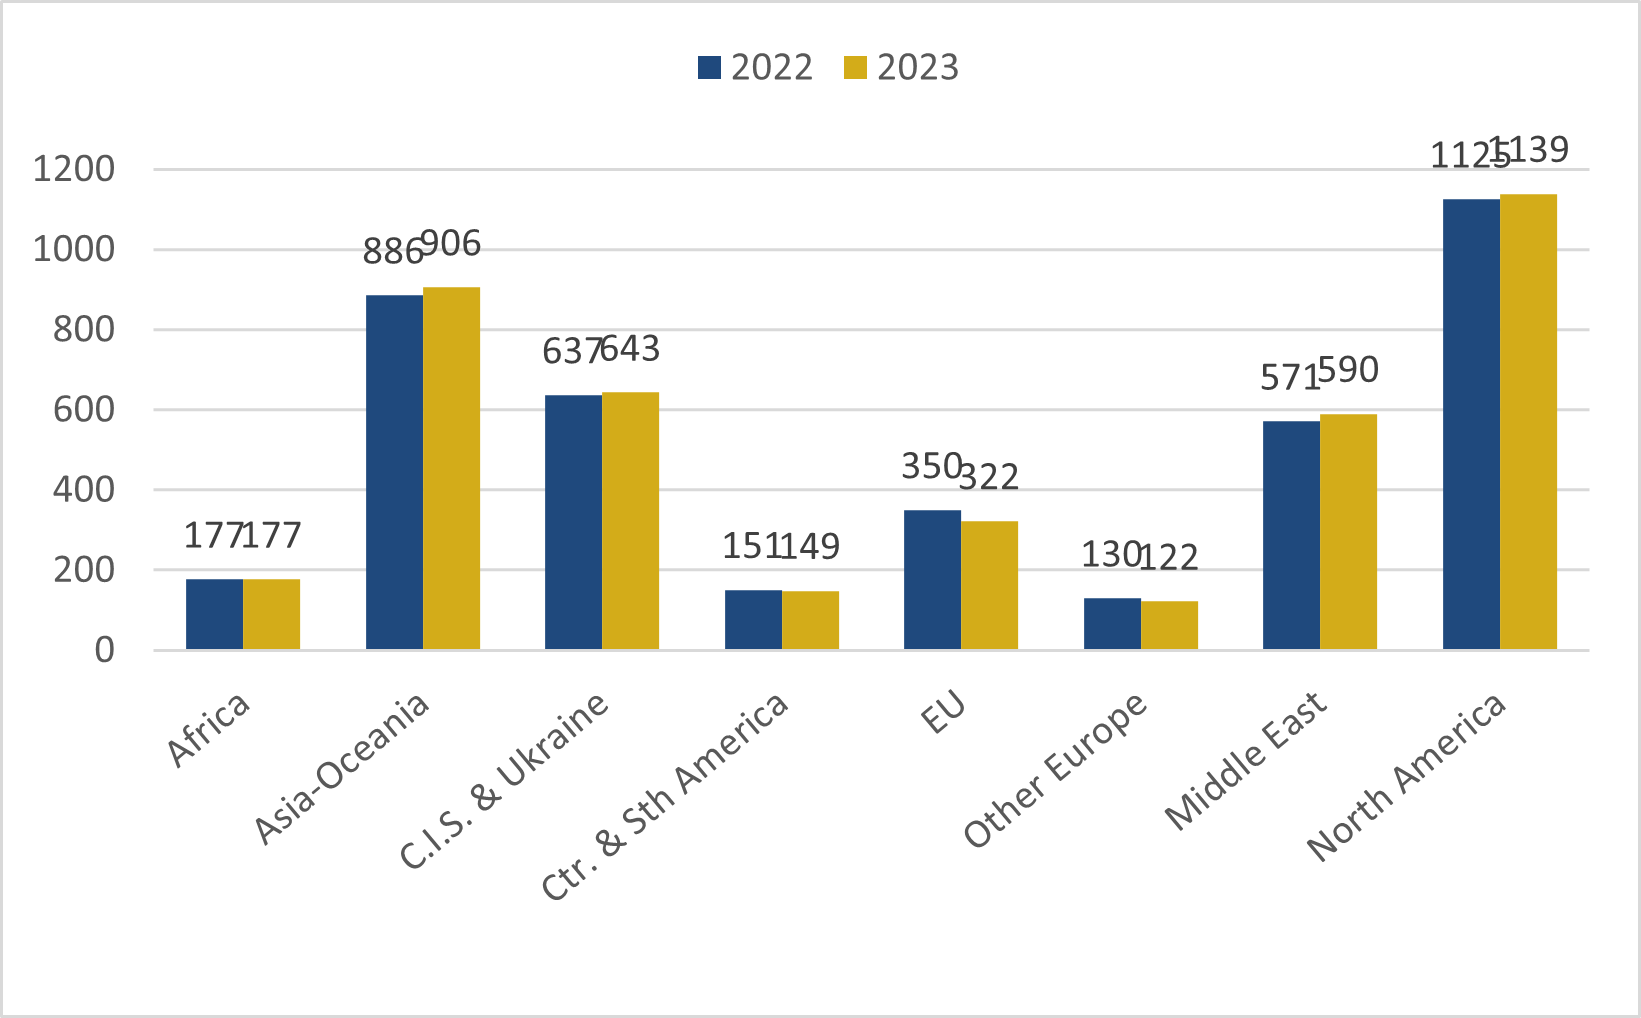
Source: Cedigaz
International gas trade pursued strong decline on Russian gas cut
International gas trade (net flows) fell significantly for the second consecutive year, down 3.3% to 980 bcm. International pipeline trade dropped by 8.6% to 455 bcm in 2023, as it continued to be heavily affected by the reduction of Russian pipeline gas flows to Europe in the context of the war between Russia and Ukraine. Russian gas pipeline exports to the EU fell by 60% in 2023 (- 39 bcm). Since 2021, Russian pipeline gas supply to Europe has fallen by over 80%, representing a loss of 113 bcm, or 28% of EU27 consumption in 2021.
The global LNG trade continued to expand, although at a more moderate pace (+ 1.8%) than the historic average. LNG’s share of total gas trade jumped from 46% in 2021 to 51% in 2022 and 54% in 2023. The US continued to lead the expansion of global LNG supply and became the largest LNG exporter, overtaking Qatar. Despite this, the LNG market remained constrained, notably because of record maintenance periods.
In Europe, the LNG market share continued to grow, from 32% of European gas supply in 2022 to 37% in 2023, whereas Russian pipeline gas (Gazprom) saw its market share slump from 30% in 2021 to 14% in 2022 and 7% in 2023.
Figure 3: Evolution of international gas trade and share of LNG
(bcm)
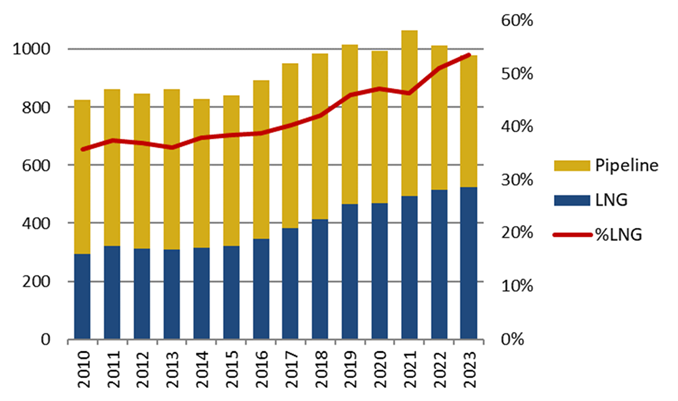
Source: Cedigaz
Gas and LNG prices fell considerably on key regional markets
In Europe, falling demand combined with historically high LNG imports and record-high inventories, exerted downward pressure on natural gas prices. However, prices remained strongly volatile and responsive to some unpredictable events like the Norwegian unplanned maintenances, Australian strikes at some LNG plants and the geopolitical tensions (Red Sea, unrest in the Middle East). Spot prices ranged from 7.3$/MMBtu to 23$/MMBtu with an average of $12.9/MMBtu in 2023 (66% lower year-on-year).
In Asia, LNG spot prices were down 57% to an average of 14.5/MBtu in 2023. The correlation between the Asian spot LNG price and the TTF remained very strong. In Northeast Asia, lower-than-average Chinese LNG demand growth and declining gas-fired power generation in Japan, which had abundant LNG storages, put downward pressure on spot prices.
Figure 4: Evolution of annual international gas prices
($/MBtu)
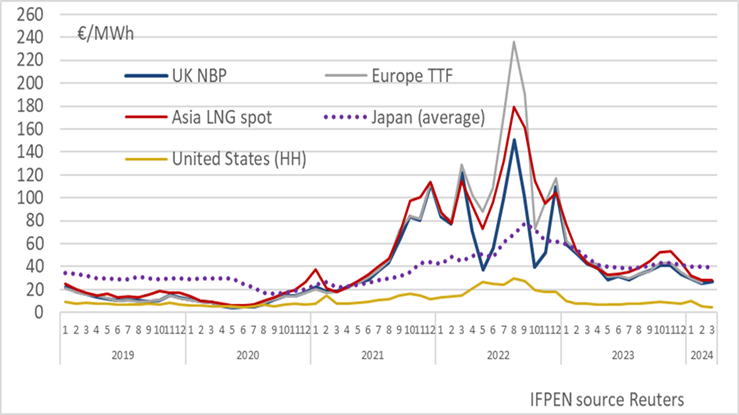
Source: CEDIGAZ, Reuters, Argus, EIA
For more information: contact@cedigaz.org
Cedigaz is an international association with members all over the world, created in 1961 by a group of international gas companies and the IFP Energies nouvelles (IFPEN). Dedicated to gas information, CEDIGAZ collects and analyses worldwide economic information on natural gas, renewables gases (biogas & hydrogen), LNG and unconventional gas in an exhaustive and critical way.