CEDIGAZ, the International Association for Natural Gas, has just released its « Medium and Long Term Natural Gas Outlook 2018 ». In CEDIGAZ Reference Scenario, which incorporates national energy plans and INDC commitments, natural gas demand will grow by 1.4%/year between 2016 and 2040 and will play a growing role in the energy mix at the expense of the other fossil fuels. The gradual shift from coal and oil to natural gas and renewables helps reduce the carbon intensity of the energy system as electrification and decarbonisation accelerate over the projection period. The expansion of natural gas markets is supported by both abundant and competitive conventional and unconventional resources, as well as a very rapid growth of spot and flexible LNG trade.
♦ Natural gas demand grows by 1.4%/year between 2016 and 2040, with China leading the growth.
- Energy efficiency gains will help curb the growth in global energy demand to about 26% between 2016 and 2040, while global economic output more than doubles.
- The transition to a lower carbon mix accelerates under Cedigaz Scenario, with non-fossil fuels accounting for more than half of the incremental energy demand over 2016-2040.
- All markets transition to a more sustainable pattern of growth, but at a different pace. The strong differences in the current energy mix by region imply different trajectories of natural gas demand. Thus, natural gas faces challenge from coal based power in India and Southeast Asia and from renewables in some markets (Europe, OECD Asia).
- Natural gas demand grows by 1.4%/year over 2016-2040, which is lower than the previous Outlook. A stronger push for renewables and energy efficiency drives gas demand growth down to 1.2%/year over 2025-2040, compared to 1.8%/year over 2016-2025.
- In absolute terms, natural gas records a volumetric gain of 1214 Mtoe over 2016-2040, with industry (including chemicals) and power each accounting for 40% of the global growth, ahead of buildings (13%) and transportation (7%).
- The largest contribution to the growth of gas-fired power generation comes from the Middle East, China and Africa.
- In relative terms, wind and solar are the fastest growing fuel sources through 2040, rising by more than 7%/year, driven by increasing competitiveness, technological advances and political support.
- The Asian region accounts for respectively 63% and 46% of the incremental demand of energy and natural gas.
- China and the Middle East lead the way in gas demand growth, accounting for respectively 31% and 25% of the incremental volume over the projection period.
- Outside China, the largest growths in gas demand are recorded in India (+ 120 bcm), Iran (+ 119 bcm), the US (+ 119 bcm) and Saudi Arabia (+ 84 bcm).
- In CEDIGAZ Scenario, energy-related CO2 emissions still increase by almost 0.4%/year to peak at 35.2 Gt CO2 towards the end of the 2030s, corresponding to a +3°C trajectory.
Changes 2016-2040 by geographic zone (Mtoe)
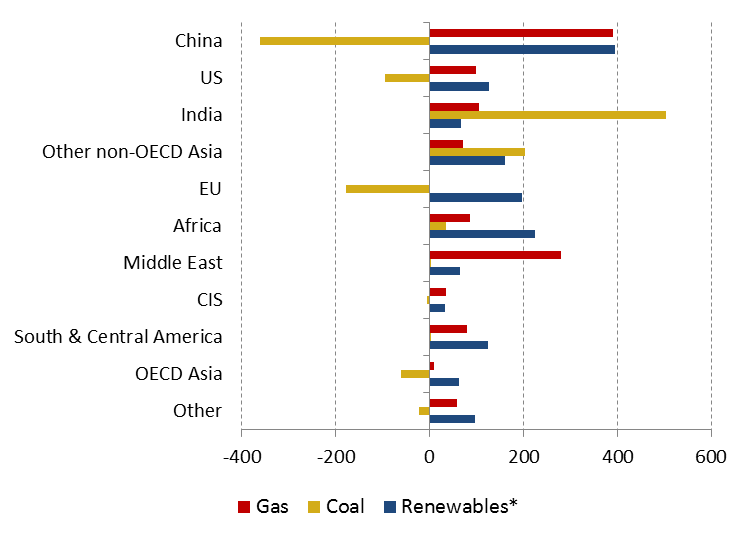 * Hydro and Bioenergy included
Source: CEDIGAZ Medium and Long Term Natural Gas Outlook 2018
♦ Natural gas supply growth is backed by both competitive conventional and unconventional gas resources.
- The expansion of global gas supply will be driven by unconventional gas in North America and Asia, as well as conventional gas in Russia and the Middle East.
- At the regional level, the largest production gains are expected in the Middle East (+ 411 bcm), North America (+ 352 bcm) and Asia-Oceania (+ 305 bcm).
- At the national level, the largest growths in volume terms are expected in the United States (+ 325 bcm), China (+ 257 bcm), Iran (+ 163 bcm), Russia (+ 112 bcm), Qatar (+ 85 bcm) and Saudi Arabia (+ 84 bcm).
- The US consolidates its leading position and will maintain a share of 22% of global gas production.
- Non-conventional gas (coal-to-gas and biogas included) provides 62% of supply growth.
- Shale gas production accounts for 45% of the increase in gas supply, driven by the US, where shale gas output rises by 2.7%/year over the outlook.
North America continues to lead the unconventional gas revolution, although China, and Argentina, will experience significant production growth. Unconventional development elsewhere will be slow and concentrated in a few countries.
Top-20 natural gas producing countries in 2040*
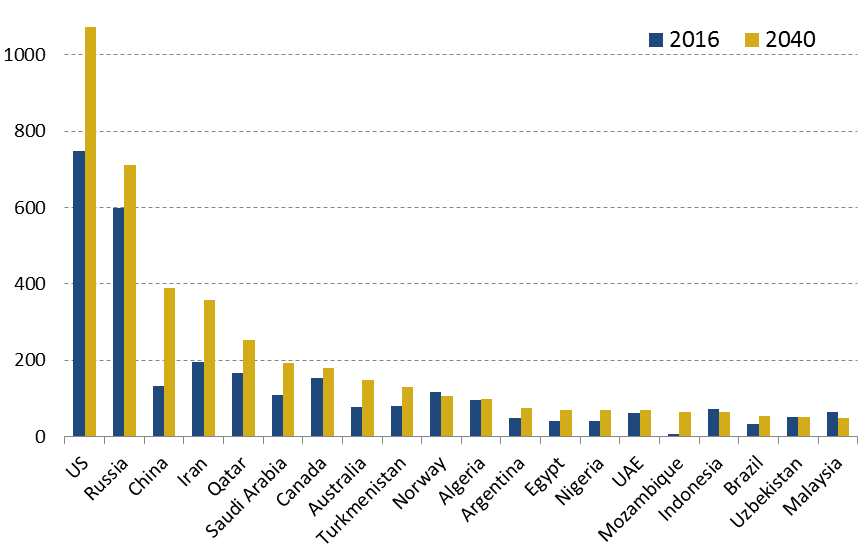 *85% of global output
Source: CEDIGAZ Medium and Long Term Natural Gas Outlook 2018
♦ Interregional trade will account for an increasing share of global supply, driving the globalization of gas markets.
- Net interregional (long distance) trade is forecast to grow by 3.1%/year from 413 bcm in 2016 to 866 bcm in 2040.
- In terms of imports, the share of Europe steadily declines from 63% to 38%, whereas that of Asia surges from 36% to 58%, underpinning a shift of trade flows from the Atlantic Basin to the Pacific Basin, which becomes more apparent after 2025.
- The CIS will remain the leading exporting region, but its market share will decline. North America emerges as a large-scale exporter, covering 20% of total net interregional exports by 2040. The largest growths in interregional flows come from CIS’ exports to China and US’ LNG exports to Asian emerging markets.
- Interregional pipeline flows grow by around 2%/year. European dependence on extra-regional imports grows from 52% in 2016 to 66% in 2040, with Russia and LNG playing a growing role to meet the supply gap.
- LNG expands more rapidly than pipeline gas. The share of LNG in net interregional flows will progress from 40% in 2016 to 55% in 2040. Interregional LNG trade will grow by more than 4%/year.
- China and India will together contribute more than 40% of the growth in international LNG imports.
- Qatar is expected to remain the top LNG exporter, accounting for 21% of global LNG supply in 2040, closely followed by the US (19%), while Australia keeps a 17% market share.
- Recent and future new LNG importers and suppliers drive the diversification and globalization of gas markets.
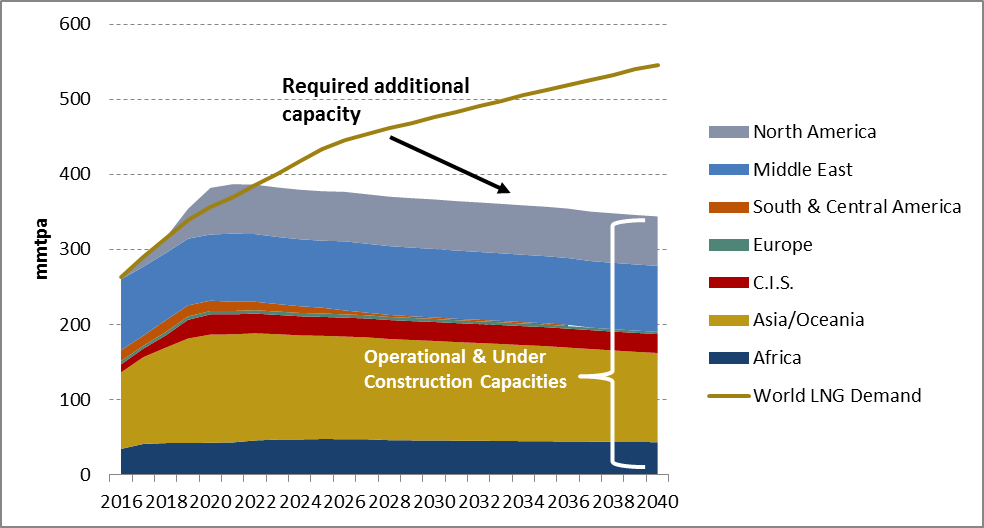
- Higher than previously expected Asian LNG demand, propelled by China, and delays in the second wave of LNG liquefaction projects bring a risk of tighter markets as early as 2022.
- It is estimated that 56 Mt of new LNG capacity, in addition to current operating and post-FID projects, is required to meet international LNG demand in 2025. The supply gap grows to 200 Mt in 2040.
Effective liquefaction capacities versus LNG demand
 Source: CEDIGAZ LNG Service
For more information: contact@cedigaz.org
Our website: https://www.cedigaz.org/
Cedigaz (International Center for Natural Gas Information) is an international association with members all over the world, created in 1961 by a group of international gas companies and IFP Energies nouvelles (IFPEN). Dedicated to natural gas information, CEDIGAZ collects and analyses worldwide economic information on natural gas, LNG and unconventional gas in an exhaustive and critical way.