Brent: Expected to fall in 2015
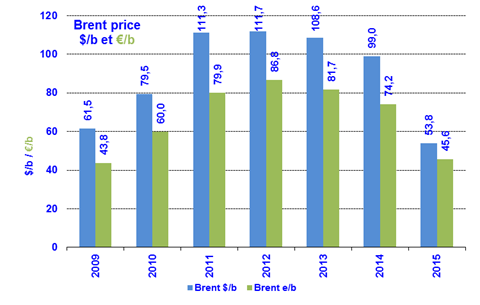 In 2014, the Brent price stood at $99/b, down by nearly $10/b compared to 2013 ($108.6). Of course, the major event of the year was the Brent’s plunge from $112/b in June to $62/b in December. The trend continued in January 2015: the Brent lost another $10 and reached $45/b. The reason for this downswing, over and above flagging economic growth and the dollar’s progression since June (-12% for the euro, worth $1.18 in January), is OPEC’s decision on November 27 to abandon the role of swing producer. OPEC aims to get producers of non-OPEC oil, LTO and high-cost unconventional oil to slow their increase in output to avoid a steady erosion of OPEC’s market share. This decision comes in reaction to the very strong hike – past and expected – of American production of LTO (light tightoil). It will be up to the market to determine the equilibrium price that will eliminate the current oversupply. In November, the market estimate of the 2015 equilibrium price was $82/b versus $64/b in December and $54/b in January. This range reflects the difficulty of determining the equilibrium price. When will the decrease in investment start to affect production? The earliest and hardest impact will be on LTOs, which require steady investment to maintain or boost output. But when will the impact occur, in what proportion and at what rate? These open questions explain why expectations fluctuate. Prices of $50-60/b for first half 2015 and $70-80/b for the second half can be envisaged.
Due to the downward revision of global economic growth in 2015 by IMF, and considering an increase in oil demand lower than expected, price forecast will be lower than envisaged in this note.
New forecasts will be presented by IFPEN, during the Panorama conference (February, 5).
NBP: Large downward corrections anticipated
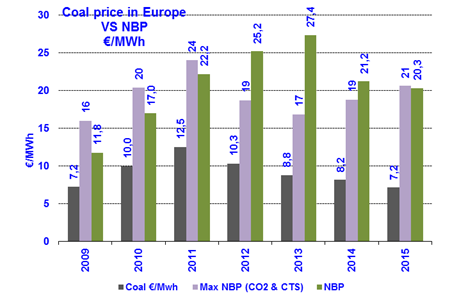
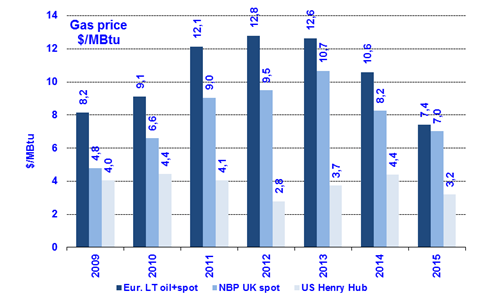 The UK NBP spot price for 2014 of €21.2/MWh ($8.2/MBtu) marked a decrease of 23% year-on-year. This movement was due to sluggish demand in the United Kingdom, down by about 10% in 2014 (-28% since 2010). Two factors help explain this fairly violent price adjustment: the mildness of Winter 2013-14 and the fact that gas was uncompetitive compared to coal in the power generation sector. The Russo-Ukrainian crisis had practically no impact on prices, but it still has the potential to weigh on the market in future. For now, the biggest trend factors are the downward shifts observed on all energy markets. The January forecasts for 2015 predict that the coal price will lose 22% in dollars and 12% in euros (falling to €50/t) while the oil price will plummet by 45% in dollars and 38% in euros. In this scenario, the NBP price projected for 2015 is €20.3/MWh ($7/MBtu), close to its level of 2010 and substantially below that of 2011-2013. This price level would make gas competitive compared to coal taking into account the rise in carbon tax support to £18/tCO2 (€23/tCo2) as of April 2015.
Long-term indexed price (indicative price): down
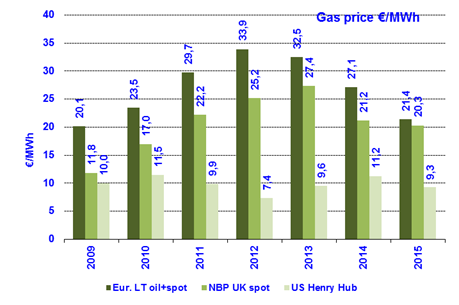 The long-term price (indexed on a combination of oil and NBP spot market prices) for 2014 was €27.1/MWh ($10.6/MBtu), lower by 17% than in 2013. The LT price profited from the regression of the Brent prices expressed in euros (-10%) and that of the NBP (-23%) as well as from the rise in the spot market’s share in supplying the oil markets. Based on the current price scenarios for oil ($54/b) and the NBP (€20.3/MWh or $7/MBtu), the LT price for 2015 could find itself at €21.4/MWh ($7.4/MBtu), which would be the lowest level observed since 2010.
Henry Hub: Under temporary pressure
 The HH price for 2014 stood at $4.4/MBtu (€11.2/MWh) up 17% year-on-year. It was influenced by price hikes early in the year (including a spike to $8 at one point) due to weather conditions, but soon fell back to about $5 in March, then to about $4 starting in July. The price quotes for 2015 were for $4//MBtu in September, $3.7/MBtu in November and $3.2/MBtu at present. This collapse is due to the fact that U.S. production is expected to rise at a time of stagnating demand. Estimated U.S. output for 2015 is expected be 750 Gm3 (72.2 bcfd),an increase of 22 Gm3 in one year and of 160 Gm3 in six years. The latter isequivalent to the production of Qatar.
It should be noted that, with an HH price of $3, the prices of U.S. LNG deliveries would be $9 to Asia and $7 to Europe, in line with current market conditions…
———————————————————————————————–
The 2015 price accounts for the prices observed and the forward market trends noted in early January, so is not a forecast.
The “LT oil + spot” price is indexed on a combination of NBP spot market prices and petroleum product prices.
Since July 2014, the formula of France’s Commission de Régulation de l’Energie has used 59.8% for the spot market (compared to 45.8 % in July 2013; 35.6 % in January 2013, 25.9 % in 2012 and 9.5 % in 2011).
The “maximum NBP” price is the price competitive with coal in the power generation sector, taking into account the price of EU ETS CO2 and carbon tax support (£9.55/tCO2 until April 2015, then £18.08/tCO2).
————————————————————————————————–
By Guy Maisonnier, Senior Economist – IFPEN