NBP: influenced by the LNG and oil markets
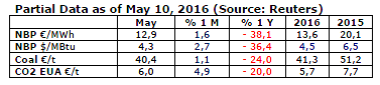
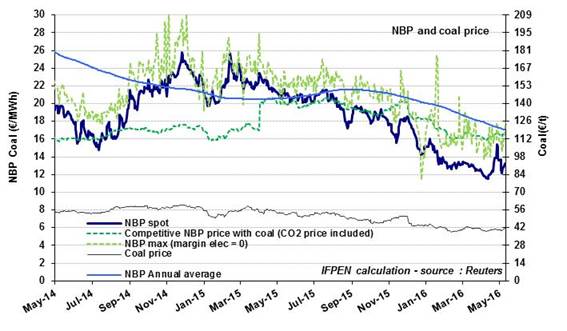 In April, the NBP saw fairly marked fluctuations, ranging from +18% to -10% compared to the monthly average. In a temporary surge, it exceeded €15/MWh ($5/MBtu) on April 26 and 27. A situation of momentarily sustained demand coincided with deficiencies of supply, resulting in heavy recourse to storage. However, monthly averages have been more stable since February, between €12.7-13/MWh ($4.2-4.3/MBtu). The price for early May and the forward quotations for the summer months (until September) stand at about the same levels. Obviously, lower prices cannot be excluded, in light of the market equilibrium conditions. On April 11, the price fell to €11.5/MWh ($3.9/MBtu), its lowest level in recent months, in step with the conditions prevailing on the LNG market in Europe at that time.
The winter quotations are pegged at higher levels – on the order of €15-16/MWh ($5.1-5.5/MBtu) – close to the prices of contracts 100% indexed on oil. Over the course of recent months, it has been possible to confirm the influence of oil prices on the NBP. The Brent price has risen about $5/b since March, leading to an upward adjustment of nearly €2/MWh ($0.5/MBtu) for forward NBP prices.
Indexed European prices: down 3% in April
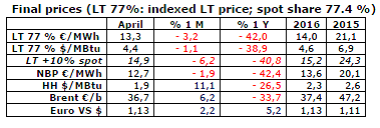
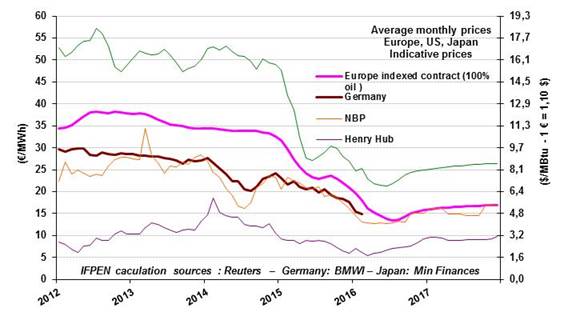 In April, the indicative European price (LT 77%) stood at €13.3/MWh ($4.4/MBtu), falling by more than 3% in a month and by 42% in a year. Given the recent trends observed for forward NBP and oil prices, the LT price could find itself at about €13/MWh ($4.4/MBtu) this summer and exceed €15/MWh ($5/MBtu) at year-end.
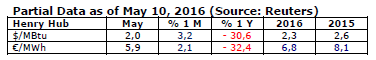
The U.S. market (Henry Hub): in the vicinity of 2$/MBtu
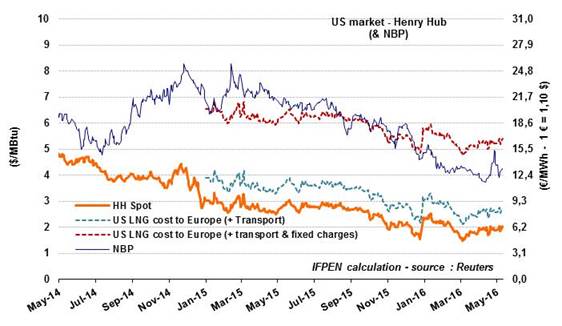 in the next few months, reaching nearly $3/MBtu in December. This rise is consistent with the outlook for market equilibrium: it is thought that U.S. consumption and LNG exports will increase, and that piped gas imports will decrease. On the production side, the collapse in drilling activity still has not had a significant effect. The number of gas drill rigs in activity has fallen to fewer than 90, versus an average of 230 in 2015 and 330 in 2014. Yet shale gas production has been impacted very little, dropping only by a very modest 1% in March from its January high. On an annual basis, total output now stands at a record 440 Gm3 (42 bcfd), i.e. 56% of the total net production forecast for 2016 (770 Gm3). The EIA is even expecting global production to rise (by 2%) in 2017 as a result of the anticipated increase in gas prices. As for LNG, the EIA is forecasting exports of 5 Gm3 for 2016 and 13 Gm3 for 2017, compared to 0.8 Gm3 in 2015. The first sales concluded at the Sabine Pass terminal in Louisiana were intended for at least five countries, including Portugal, Brazil and Argentina.
N.B.: The current wildfire in Alberta (70% of Canadian gas production) has not affected the U.S. price. On the other hand, gas prices in Alberta have plummeted because of lower gas demand coming from oil industry units.
By Guy Maisonnier – Senior Economist – IFPEN