Brent: shrinkage anticipated in 2014
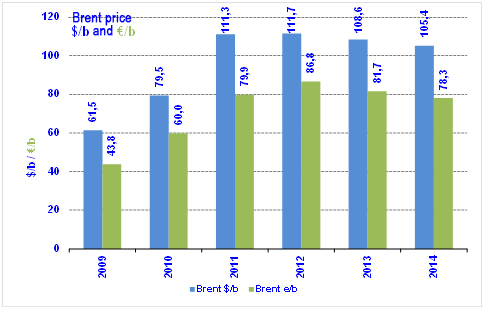 Since the beginning of the year, Brent has varied between $98/B (September) and $115/B (at the beginning of June), which is fairly close to the extremes seen in 2013. The anticipated average for 2014, which has fluctuated between $105 and $110/B, is currently situated at $105/B, slightly down on 2013 ($108.60/B). Movements the price of Brent remain highly uncertain in the light of possible influencing factors: whether or not there is an increase in exports from Libya; whether or not negotiations with Iran on nuclear power are successful (deadline postponed to 24 November); whether or not the insurgents in Iraq affect production and exports in the south of the country; whether or not the tension in Ukraine escalates; the dollar exchange rate (increasing against the Euro since May, a factor depressing the oil price); the global economic climate (increased growth expected in 2015) and the outlook for the stock exchanges. The field of factors affecting the price of Brent is therefore obviously very wide. In any case, the increase in US production due to shale oil is playing a moderating role and partly explains the slight decline experienced since 2012.
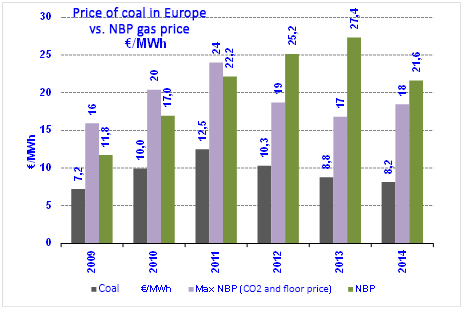
NBP: drop in summer, pressure to come?
 The UK NBP spot price has seen a very strong downward correction during 2014 under the effect of the new drop in gas consumption in the United Kingdom (-14% in one year and -30% since 2010). This drop is the result of two factors: on the one hand the uncompetitiveness of gas compared with coal in the electricity sector since 2012 and on the other, the mildness of winter 2013/2014, which explains the dive in consumption since November 2013. This pressure has dragged NBP down below the price that makes gas competitive with coal (approximately €18/MWh). It lost 40% of its value between January (€27/MWh, $10.80/MBtu) and June (€16.20/MWh, $6.40/MBtu). Under the influence of the approach of winter and partly due to the Russia/Ukraine tension, the market is banking on a significant increase in price at the end of the year (€26-27/MWh in December, close to the previous winter’s average). On this basis, the average in 2014 would be €21.60/MWh, a substantial drop against 2013 (-21%). For 2015, it should be noted that the carbon tax (Carbon Floor price) will rise to £18/tCO2 (about €23/t) in April vs. the current figure of £9. The price required to keep NBP competitive with coal will therefore be higher (€22/MWh), limiting its downward potential.
Long term indexed price (indicative price): dropping
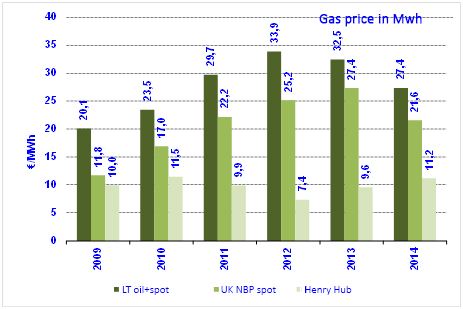 The long-term price (combined oil and NBP spot market) has decreased significantly since January (€30.90 to €23.30/MWh in July), benefiting from the slight decrease in the price of Brent in Euro and particularly from the decline of the NBP, and of course taking into account a current spot share of almost 60% (previously 45.8%). Given the prospect of a rise in the NBP, the price of LT should be following the same trend by the end of the year (€29/MWh anticipated in December). On the current basis, an average price in 2014 of €27.40/MWh ($10.80/MBtu) is conceivable. The LT price would be 28% higher than the NBP price in 2014, compared with 19% in 2013 and 35% in 2012.
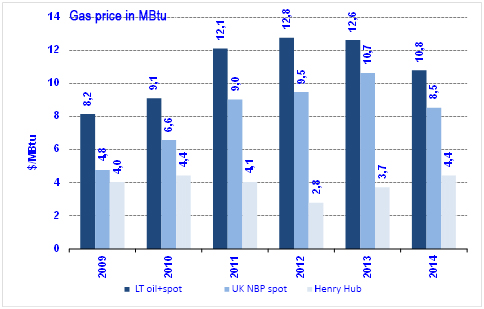
Henry Hub: temporary pressure
 The Henry Hub price was strongly affected by the extreme cold early in the year, peaking at around $8/MBtu in February and March (monthly averages of $6 and $4.90/MBtu). Vigorous mobilisation of stocks maintained relative pressure on the price until June ($4.60/MBtu). In the face of moderate demand in July in the electricity sector, and given the strong increase expected in production, the price fell in August to under $4. Taking current expectations into account (stability at $4), a price of $4.40/MBtu is conceivable for 2014 (+19% against 2013). As far as production is concerned, September’s
 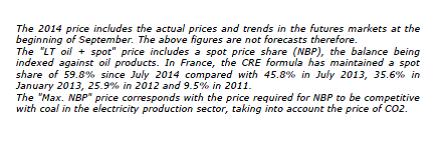 statistics anticipate marketed production of 760 Bcm (73.9 BCF/day) this year (+38 Bcm up on 2013) and 780 Bcm (75.5 BCF/day) in 2015.) The total rise over eight years is 200 Bcm, the equivalent of twice the production of Norway. This figure reflects the “shale gas effect”, with production of shale gas currently standing at 350 Bcm.
By Guy Maisonnier – Senior Economist, IFPEN