Brent : $40-60/b in 2016 (2015: $52/b)
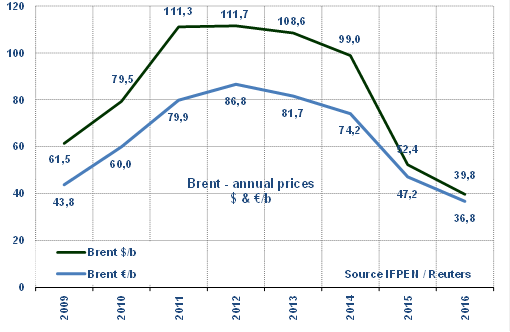 The Brent averaged $52/b in 2015, down 47% compared to 2014 ($99/b). The very disturbed geopolitical context had little impact on prices, apart from concerns arising early in the year after Saudi Arabia and its allies intervened militarily in Yemen, starting on March 26. All in all, excess supply defined the price which, after August, stayed below $50 and fell to $38 in December. Downward price pressures were due to the continued OPEC policy in favor of defending market share and the fact that U.S. production only registered a small decrease. Price forecasts for 2016, based on the futures markets, have been in the $40-60/b range since August 2015. Prices will be influenced by the following key factors:1/ the actual rate of economic growth, potentially “disappointing and uneven” according to the IMF; 2/ Iranian exports, likely to rise by at least 0.5 Mb/d; 3/ how far U.S. production falls as a result of reduced drilling activity; 4/ the effects of the decrease in upstream investment; 5/ whether OPEC policy – unchanged since year-end 2014 – changes or not; 6/ the influence on production of growing regional tensions in the Middle East. Looking at the supply-demand balance alone, the market could start to rebalance at the end of 2016, which could gradually put pressure on prices.
Prices for 2016 mainly reflect changes in forward prices and can not be considered as forecasts. Economic, climatic or geopolitical context may in particular greatly impact future trends.
NBP: €15-19/MWh in 2016 (€20/MWh; $6.5/MBtu in 2015)
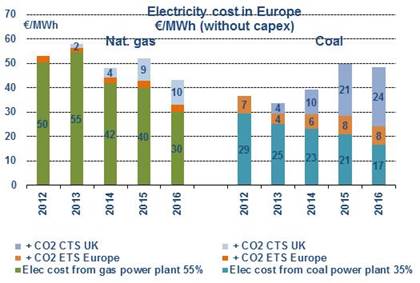
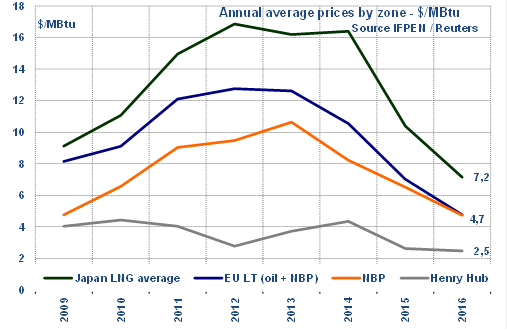
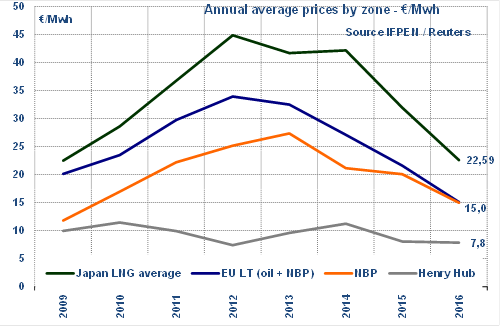
In 2015, the NBP averaged €20/MWh, down 5% over 2014, in a structural trend that got underway in early 2013 (€27/MWh) before the oil price collapsed in mid-2014. Expressedin U.S. dollars, the NBP stood at $6.5/MBtu, down 21% due to the euro’s weakness (-16% in 2015).In the United Kingdom, 2015 saw gas once again become competitive with coal, despite a substantial fall in the coal price (-25% in $/t and -9% in €/t). This was partly due to the increase in Carbon Tax Support, which stood at £18/TCO2 (€25/TCO2) in April 2015 compared to £9.5/TCO2 in 2014. Another effect of this tax was to support the price of electricity, ensuring the profitability of gas-fired power plants. This did not happen in Europe, where the CO2 price is low, averaging only €8/TCO2 in 2015.In early January, the futures markets were predicting an even lower NBP price for 2016, i.e. in the vicinity of about €15/MWh ($4.7/MBtu), close to the conditions prevailing in 2009-2010. A rise towards the coal-to-gas switching price (€18/MWh or $5.7/MBtu) remains a possibility. This price could be exceeded in the event of pressure on the market (e.g. harsh winter weather).
Long-term indexed prices: €15-19/MWh in 2016
 The long-term price (indexed to a combination of oil and NBP spot prices; NBP spot share: 77%) could find itself at about €15/MWh ($4.7/MBtu) for 2016, which would represent a decrease of 29% compared to 2015 (€21.1/MWh). This evolution accounts for January’s expectations concerning the oil price ($40/b in 2016) and the euro (-2% at $1.09). If the oil price were to rise to something like $55-60/b, the long-term price could be close to €19/MWh ($6/MBtu). It must be noted that a new convergence exists between spot prices and indexed prices in long-term contracts that seem to define the floor price. Previously, they defined the floor price during periods of high pressure.
The Henry Hub price: $2.2 to $3.1/MBtu in 2016 ($2.6/MBtu in 2015)
The Henry Hub averaged $2.6/MBtu in 2015, down by nearly 40% in one year. This historically low price is even lower than in 2012 ($2.8/MBtu). The downward pressure reflects the continuing rise in U.S. production, now estimated to be 775 bcm (74.9 bcfd) in 2015 (+6% over 2014). The progression is spectacular: a five-year increase of 170 bcm (equivalent to total Canadian output) and a ten-year increase of 260 bcm (nearly half the Russian output, i.e. 580 bcm). For 2016, the EIA pegs the increase at about 790 bcm, meaning that the U.S. could achieve self-sufficiency in natural gas, knowing that its oil dependence rate was in the 14-17% range prior to 2007. The average price anticipated for 2016 reflects the “plentiful supply” context and has hovered between $2.2 and $3/MBtu for six months. There remains some uncertainty as to how the slump in drilling activity (54% in one year) will affect production. A lower-than-expected rate of growth cannot be ruled out, which could weigh slightly on prices.If one retains a 2016 average of $2.6/MBtu, the same as in 2015, LNG export prices would be $5-7.6/MBtu for Asia and $3.7-6.4/MBtu for Europe. These figures may or may not account for fixed costs but do include transport costs. These prices are competitive with those forecast for Asia ($7.2-8.6/MBtu) and Europe ($4.8-6/MBtu) based on an oil price of $40-60/b. The first LNG exports linked to the shale gas revolution will start in 2016. According to the EIA, they could reach 6.7 bcm (0.55 bcfd).
 |
 |
By Guy Maisonnier – Senior Economist – IFPEN