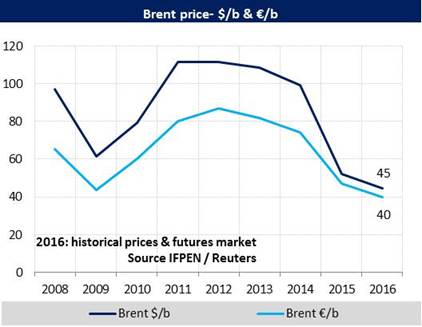
The Brent at $40-48/b in 2016 (vs. $52/b in 2015)
The Brent price averaged $39/b for first-half 2016, i.e. 25% lower than the 2015 average of $52/b. If the price were to remain within the $40-60/b range from now until the end of the year, the 2016 average would fall between $40 and 47/b.
The Brent rose steeply (+58%) between January ($31/b) and June ($48/b). The first quarter was dominated by economic fears, which gave rise to sharp downward corrections on the financial markets between December and February 2016. This led to some very pronounced downward movements on the oil market early in the year. On January 20, for instance, the Brent fell to $26/b, losing $10 in less than one month. The “Brexit effect” has also brought the oil price down: on June 24, the price fell to $46.7/b (-4%) due to Brexit-related financial and monetary consequences (e.g. a rise in the dollar) and economic uncertainties.
Even so, the trend since January has continued to be oriented upward, fueled by the weakness of the dollar until April and also by expectations of seeing a gradual shrinkage of the surplus oil supply. The underlying reasons were the relatively sustained oil demand in 2016 and the steady decline in U.S. production of tight oil since June 2015. Conjunctural factors also weighed on the price, especially production shortfalls in Canada and Nigeria. All of which served to offset the strong rise in supply from Iran, where production may have reached a plateau.
 |
 |
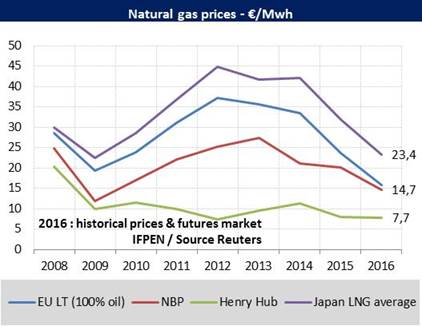
NBP: €12.4-15.5/MWh in 2016 (vs. €20/MWh ; $6.5 /MBtu in 2015)
Since 2015, 100% oil-indexed contracts have been exerting downward pressure on the market price for gas in the United Kingdom (the NBP). In conjunction with a mild winter, this caused extremely low prices (in the vicinity of €13/MWh or $4.2 /MBtu), until last April. Since then, the NBP has tended to fall into line with what had previously defined the upper threshold, namely, the 100% oil-indexed contracts. This new convergence has two explanations. First, the indexed prices are low, which limits how far market prices can fall. Second, sustained gas demand in the power sector is supporting prices. Demand is up, because the Carbon Tax Support (CTS) in the United Kingdom makes natural gas more competitive with coal.
This convergence, together with the upswing in oil prices since February, indicates that the market expects the NBP price to go up. The 2016 average has climbed from €12.4 /MWh in April to about €15/MWh at present (i.e. from $4.1 to 5.1/MBtu). However, this year’s average is still an estimated 25-38% below last year’s. Of course, these forecasts are subject to change, depending on how oil prices and market equilibrium conditions evolve. The “Brexit effect” on currencies and economic growth in the U.K. will also weigh on gas prices. In the last few days, the NBP for 2016 has dropped from €15.4 /MWh (June 22) to €14.7 /MWh (June 28).
Brexit, currencies and oil
The day after the Brexit vote, the NBP price expressed in £ saw a strong increase (+3.6%). Certain market factors, such as the constraints at the Rough storage site and the announcement that the production quota in the Netherlands will be reduced, might suggest a “cause and effect” relationship. The decrease of 4.6% in the TTF price expressed in € in the Netherlands indicates that other factors were in play, especially the respective decreases in the oil price (-4%), the value of the euro to the dollar (-2.8%) and that of the pound sterling to the euro (-5.4%).
Overall, the chain of causality went something like this: The Brexit vote -> economic fears in the UK and for the EU -> rise of the dollar against the euro and the pound sterling > fall of the oil price in $ (monetary and financial effects) -> fall of oil-indexed gas prices -> fall of the reference price for the United Kingdom in $ -> impact on the gas price in € attenuated by the weakness of the European currency -> upward adjustment of the NBP gas price further to the pound-euro parity.
If the situation stabilizes with respect to the euro and the dollar, the Brexit effect might be limited to the NBP price expressed in pounds sterling. The depreciation of the British currency, if this scenario unfolds as expected, will make the British gas price more expensive compared to the pre-Brexit situation.
 |
 |
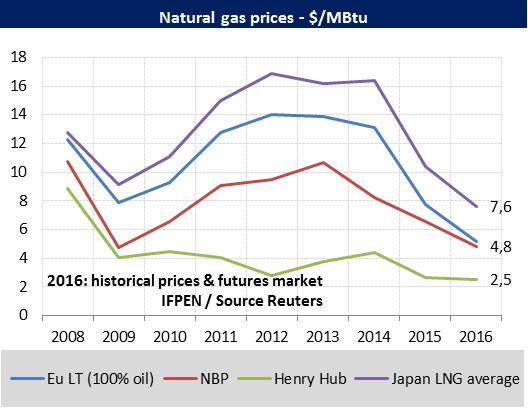
Henry Hub: $2.2-2.5/MBtu in 2016 (vs. $2.6/MBtu in 2015)
The Henry Hub price for 2016 has hovered in a very low range ($2.2 to 2.5 /MBtu) since the beginning of the year, with an upturn starting in May. The high level of stocks, owing to a mild winter, kept prices low until May. Since then, they have made large gains (+30% in June, to nearly $2.9/MBtu), driven by uncertainties as to the actual level of future production as well as demand from the power sector (the “air conditioning effect”). The increasing sensitivity of gas prices to high temperatures can be attributed to the rise in gas’s share of the electricity production market. In 2015, that share reached 33%, equivalent to that of coal, as opposed to 20% ten years ago, when coal represented 50%.
Since the beginning of the year, futures markets have been projecting low prices for 2017. These prices ($2.7-3.1/MBtu) are in line with EIA forecasts bearing on the U.S. gas balance. For next year, the EIA says that U.S. production will hit a record high (790 bcm or 76 bcfd), despite lower drilling activity. This projection may be overoptimistic, for there are fewer than 100 drill rigs currently in activity, as opposed to more than 200 in 2015 and more than 300 in 2016. The EIA statistics on monthly production at shale gas basins indicate a non-negligible decrease since December (-4%).
The U.S. gas balance also shows that net imports are forecasted to be virtually nil in 2017. In fact, piped imports, now very low (about 15 bcm), will be approximately equivalent to LNG exports. The latter, estimated at 12 bcm for next year, should register a strong progression: new liquefaction units, now under construction, are slated to come onstream and boost production capacity to 80 bcm (2.9 tcf/year). Whether this gas will be shipped to Europe, Asia or South America will depend not only on demand, but also on the margin expected, the difference in delivery costs and regional spot prices. Nothing is set at this point, but wherever the gas is shipped, the effect will be to weigh on regional LNG prices.
By Guy Maisonnier, Senior Economist, IFPEN