In 2021, global gas demand surged 4.5% and recorded the largest volumetric growth on record, with an annual gain of 173 bcm that more than offset the 2020 2% decline. This strong rebound took place in the context of a faster than expected economic recovery following the lifting of lockdowns and a strong growth of global energy demand. Both economic, geopolitical and weather factors contributed to the growing and unprecedented tightness of the global gas market. They led to an explosion of Asian and European spot prices to historic highs.
Global marketed gas supply surged 4% in 2021
Global marketed natural gas supply increased strongly by 4% to 4008 bcm in 2021. Strong economic recovery, gas market reforms in some countries, higher oil and gas prices and increased OPEC quota stimulated both dry and associated gas production, as well as unconventional gas (North America, China, Argentina). At the national level, Russia posted an incremental production of 64 bcm, followed distantly by the United States (+ 19 bcm), China (+ 16 bcm), Algeria (+ 15 bcm) and Egypt (+ 9 bcm).
Figure 1: Marketed gas production by region (bcm)
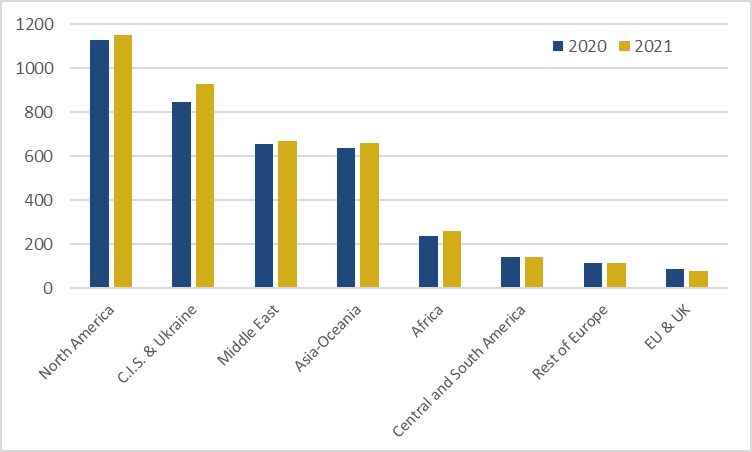
Source: Cedigaz
Global gas consumption posted a strong rebound of 4.5%
The impressive recovery of global gas demand in 2021, up 4.5% to 4028 bcm, was concentrated in the first half of the year. World gas consumption was boosted by a strong post-Covid economic recovery in the first half and extreme weather events, including:
-Colder winters (Northeast Asia, Europe, Russia),
-A long winter 2020/21 and an exceptionally cold spring (Europe),
-Hot summers, severe droughts (Brazil, China, Iran) and lower hydro levels,
-Lower than expected renewable generation (lower wind in Europe, lower hydropower worldwide).
In many countries, the growth of natural gas consumption was driven by power generation, thanks to both political support and favourable economics in a context of higher coal and carbon prices.
At the regional level, the largest growths in demand were posted in Asia-Oceania (+ 6.6%; + 55 bcm), driven by China and to some extent, South Korea, the CIS (+ 8.4%; + 51 bcm), under the impetus of Russia, and Europe (+ 7%; + 36 bcm).
At the national level, the largest increases were recorded in Russia (+ 47 bcm) and China (+ 42 bcm), followed distantly by Turkey, Brazil, Iran, Italy and South Korea.
Figure 2: Natural gas consumption by region (bcm)
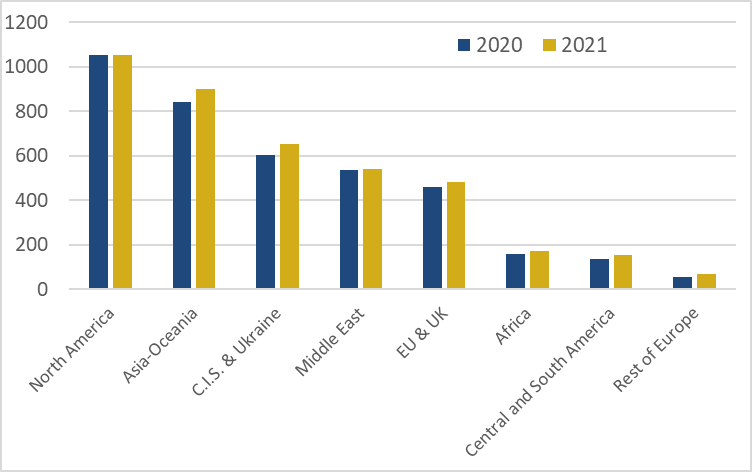
Source: Cedigaz
International gas trade recorded its strongest growth since 2010
These developments from both the demand and supply side created a growing gap between supply and demand in Asia and Europe, where import dependence on extra-regional sources increased. Furthermore, the region of South and Central America turned from a net LNG exporter to a net LNG importer. Reversely, there was a growing supply surplus in the CIS, as well as in North America and Africa. In consequence, international gas trade (net flows) rebounded by almost 7% to 1038 bcm in 2021, after a 2% decline in 2020. This is the strongest growth since 2010, which can be attributed to a record growth of pipeline trade (+ 41 bcm; + 7.8%) as well as a significant growth of LNG trade (+ 25 bcm: + 5.4%). The share of international gas trade in global supply increased to 26.5% in 2021. In the last five years, the share of LNG supply in total gas trade gained 10 points to reach 47% of international gas flows today.
In Europe, despite a strong growth in pipeline gas imports from Norway, Algeria and Azerbaijan (Trans-Adriatic Pipeline), massive storage withdrawals were needed to meet the fast-growing demand and compensate for a decline in indigenous production, as well as in LNG and Russian pipeline imports. This resulted in record-low storage levels amid an extreme market tightness.
Figure 3: Evolution of international gas trade and share of LNG
(bcm)
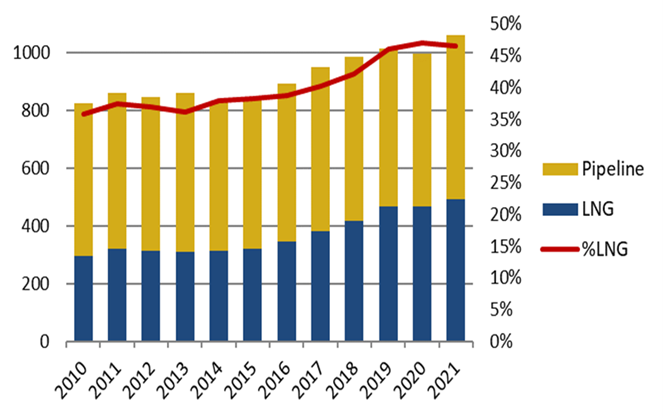
Source: CEDIGAZ
Natural gas prices exploded to all-time highs
In 2021, European and Asian spot prices pursued their bull ride and exploded to new historic highs at year-end in a context of unprecedented supply tightness and geopolitical tensions (Russia/US/Ukraine, Nord Stream 2, Algeria).
The annual European spot (TTF) price increased fivefold in 2021 to 15.9$/MBtu, while the Asian spot LNG price increased more than fourfold to 17.9$/MBtu. The US Henry Hub almost doubled to 3.9$/MBtu, its highest level since 2014, reflecting tighter market conditions. The Japan average LNG price was estimated at 10.3$/MBtu in 2021, up 27% from 8.1$/MBtu in 2020.
The extreme variability and new record spot price volatility in 2021 contributed to growing incentives to minimise risk in an increasingly unpredictable market, encouraging the signature of long-term contracts and discouraging spot purchases.
Figure 4: Evolution of annual international gas prices ($/MBtu)
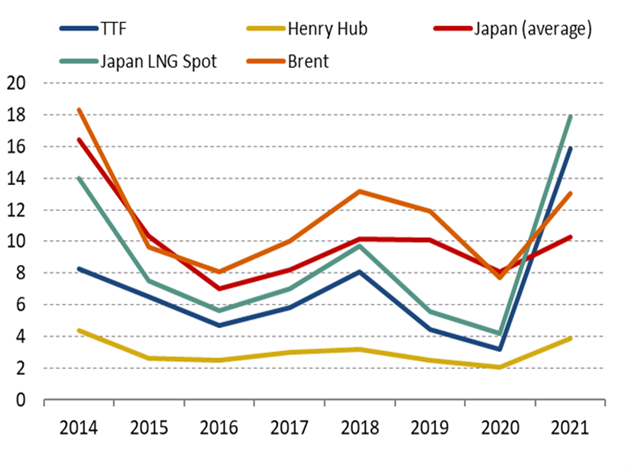
Source: CEDIGAZ, Reuters, EIA
World gas production and transportation approached their maximum capacity
In 2021, most of gas producing countries, with the exception of Russia, approached their ultimate production capacity, even if this latter was reinforced on some large fields (Troll in Norway, Hassi R’Mel in Algeria) or if a few new projects started production (Egypt, Russia, Malaysia).
The global spare production capacity fell strongly in 2021, to represent only a marginal share of 1% of world gas production today, with the bulk of it concentrated in Russia. The sharp drop of spare production capacity in 2021 is mainly due to the recent but growing imbalance in the LNG market. The acute lack of investments in the last years points a persistent tightness on the global LNG market in the next three years. Additional LNG investments are needed to meet the growing LNG supply gap after 2025.
In 2021, underground gas and LNG storages played an important role to balance gas demand and supply, to meet growing winter demand in 2021 and ensure security of supply for winter 2021/2022.
In 2021, the international pipeline transportation capacity was sufficient to ensure long-distance transportation and a strong expansion of the following main flows:
-European imports from Norway, Algeria (despite the closure of the MGE pipeline at end-October) and Azerbaijan (Trans-Adriatic Pipeline),
-Turkey’s pipeline imports from Russia (TurkStream pipeline),
-Russia’s pipeline exports to China (Power-to-Siberia Pipeline),
-Central Asia’s pipeline exports to China (Central Asia-China Gas Pipeline, lines A, B & C).
For more information: contact@cedigaz.org
Cedigaz is an international association with members all over the world, created in 1961 by a group of international gas companies and the IFP Energies nouvelles (IFPEN). Dedicated to gas information, CEDIGAZ collects and analyses worldwide economic information on natural gas, renewables gases (biogas & hydrogen), LNG and unconventional gas in an exhaustive and critical way.