Free downloads

Oil and Gas Majors in India: Co-creating the Gas and LNG Market
The entry of big players into the downstream gas market, in partnerships with strong Indian partners, offers a key leverage to the Indian vision to realise a gas market-based economy. They can deliver competitive and affordable LNG supplies and accelerate gas infrastructure build out, thus solving two key bottlenecks on the Indian gas market. Energy majors will facilitate and accelerate gas market growth and enlarge the gas market with innovative solutions adapted to Indian conditions. A larger gas sector augurs well with Indian economy as well as for the environment and is a win-win situation for all stakeholders.
While the COVID-19 crisis has introduced an additional uncertainty to natural gas demand growth, the Indian gas market fundamentals are robust and long-term growth propects remain strong.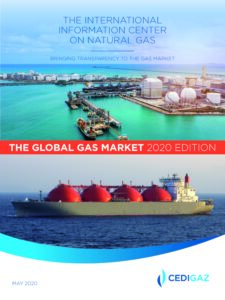
THE GLOBAL GAS MARKET 2020 EDITION
The demand for natural gas continued to display sustained growth in 2019 (+2.3%), to the detriment of coal. This growth is lower compared to the two previous years but in line with the historic 10-year average.
The main factor was the competitiveness of gas in a context of oversupply which encouraged switching from coal in the power and industry sectors, chiefl y in the United States and the EU.
As a result, the share of gas in the energy mix continued to rise. Today, this share is estimated to be 23%, compared to 21% in 2010. Recent developments suggest that the power market has embraced the energy transition through a growing role of natural gas and renewables.
The US remained the largest contributor to both supply and demand growth thanks to the abundance of low-cost shale and associated gas resources. US gas production continued to increase in 2019 at a much faster rate than consumption, thereby creating a large surplus destined for exports.
China was the second largest demand growth area again, even if the expansion of gas demand slowed to 8.6% in a context of weaker economic growth and the relaxation of Chinese policy on coal-to-gas switching.
International trade (net fl ows) expanded strongly by almost 4% only due to the growing abundance of highly competitive LNG supply which displaced pipeline gas, especially in Europe. LNG demand growth slowed in Asia, while Europe absorbed much of the surplus LNG, acting as a balancing market.
As global natural gas supply growth largely outpaced demand growth, a significant amount of natural gas was injected into storages. In a context of LNG overhang, spot prices on the Asian and European markets plunged by more than 40% compared to 2018. New pricing and trading patterns reshape the global gas market which increasingly relies on spot-priced and fl exible gas supply.

Underground Gas Storage in the World - 2019 Status
- At the end 2018, there were 662 underground gas storage (UGS) facilities in operation in the world. The global working gas capacity reached 421 bcm
- North America concentrates more than two thirds of the sites and accounts for almost 40% of global working gas capacity and half of global deliverability, the top five countries (United States, Russia, Ukraine, Canada and Germany) account for 70% of the worldwide capacities
- Storage in depleted fields dominate with 79% of global working gas volumes, but storage in salt caverns now accounts for 26% of global deliverability
- In 2018, the growth in gas storage capacity contrasted with the trends observed since 2015
- At worldwide level, there are 102 identified projects at different stages of planning
- UGS development activity is dominated by China, which alone accounts for almost half of the 37 bcm of working gas capacity under construction
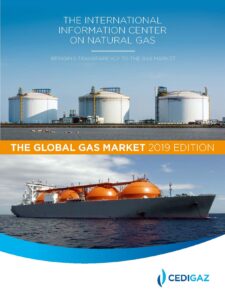
THE GLOBAL GAS MARKET 2019 EDITION
2018 has been a remarkable year for the global natural gas market. Global natural gas demand surged 4.7% to 3,850 bcm, driven by the US and China. The US was the standout performer, accounting for 45% of the global increase in both the consumption and supply of natural gas.
2018 marks the second year of strong growth of natural gas demand, after a 3.5 % rise in 2017. It also recorded the highest growth of gas demand since the post-crisis rebound of 2010.
This fast expansion was driven by the abundance of competitive gas supply, especially in the US and in Russia and by supportive energy and environmental policies, in some countries, particularly in China. Investment in transport infrastructure also contributed to bolster gas penetration in key markets.
China became the largest net importer of natural gas in the world before Japan. Chinese net imports jumped by 32% and accounted for more than 80% of the global increase in net imports, once again highlighting the crucial role of China in absorbing global gas production.
Like in 2017, the expansion of natural gas demand was part of a substantial global growth in world energy demand, driven by a robust global economy and extreme weather conditions.
Strong gas demand growth in Asia contributed to a rise in market prices in key areas and prevented the formation of a global LNG bubble.

THE IMPACT OF NEW MARINE EMISSIONS REGULATIONS ON THE LNG MARKET
- What are the IMO emissions standards coming into force in 2020 and where do they apply?
- What are the possible options for ship owners?
- What are the opportunities for the LNG market?
- Current state of play – how is the industry planning for the 2020 regulations?

BLUE SKIES AND NATURAL GAS IN CHINA
Underground Gas Storage in the World - 2018 Status

The Future of Natural Gas in China and India - Critical Drivers and Challenges
Medium and Long Term LNG Outlook 2018

Ten major trends in the European gas market
India's vision to a gas-based economy, drivers and challenges
Medium and Long Term Natural Gas Outlook 2017
The rise in coal prices: Beijing policy drives EU coal-to-gas switching

Overview of Underground Gas Storage in the World 2017–Status
Does LNG have a long-term future in the United Arab Emirates?
Post COP21 - What does the future hold for gas in Southeast Asia?
Post-Sanction Iranian Natural Gas Production and Export Potential: Challenges and Opportunities
Is China's Golden Agen Of Gas Over Before It Began?
A lot of hot air? To what extent could gas lose ground in the heating market in Europe
Subsidy – blessing or curse? An Assessment of Impact of Gas Price Subsidies on Gas Markets and Consumers
U.S. Natural Gas Update and Outlook
Russian Gas Market: Entering New Era

Waiting for the Next Train? An Assessment of the Emerging Canadian LNG Industry

Japan's New Energy Policy - In search for stable and competitive energy supply
