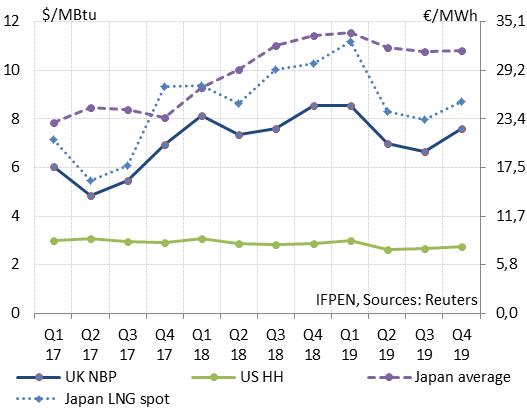
– In Asia, the average price of gas imports to Japan has risen since year-end 2017 in step with the uptrend in the oil price. LNG spot prices are under pressure and approaching those of oil-indexed contracts.
– These conditions have affected the European market, where price levels for Q2 and Q3 are relatively high.
– In the U.S., the Henry Hub price was lower in Q2 than Q1, due to the magnitude of U.S. natural gas output.
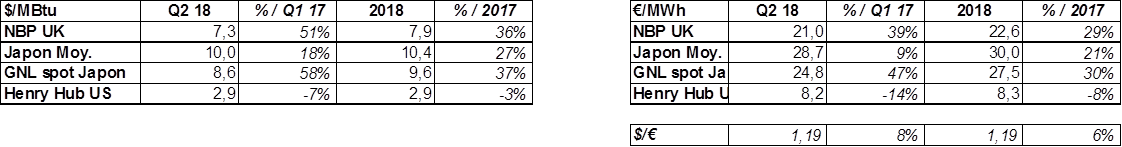
Globally, based on current information, average 2018 prices look to be up sharply in Europe (+36%) and Asia (+30-40%), but down in the United States (-3%).
Figure 1: 2017-19 gas price, by quarter: United Kingdom, Japan and the United States ($/MBtu and €/MWh)
Global trends
Prices in Asia trending upwards in 2018
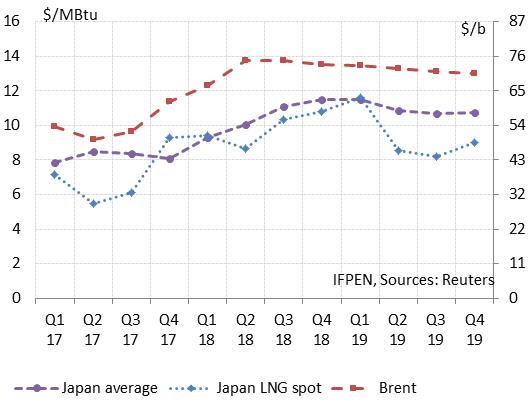
In Q2, the average price of imports to Japan stood at $10/MBtu, up from $9.3/MBtu in the previous quarter. It may progressively near the $12/MBtu mark in Q1 2019 (Figure 2), a direct result of the hike in the oil price, which averaged $74/b for Q2. The current pressure reflects uncertainty over the future supply from certain countries, such as Libya, Venezuela and Iran (due to the U.S. embargo). At the same time, uncertainty about the economic environment has had a moderating effect.
|
Figure 2: Gas price in Asia and Brent price
|
Figure 3: World LNG imports, by month
|
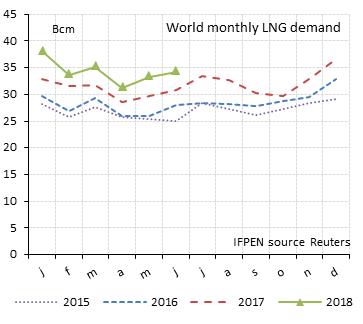
LNG spot prices in Asia are also under pressure from sustained world demand (Figure 3) driven largely by Asia countries. Consequently, they are nearing the long-term contract prices. In June and July, the spot price, which had averaged $8.6/MBtu in Q2, exceeded $10/MBtu in alignment with long-term contract prices.
For now, the forward markets are expecting pressure to continue until Q1 2019, with prices approaching $12/MBtu, the reference price for oil-indexed contracts with that time horizon. A return towards $8/MBtu is anticipated for spring and summer 2019, probably due for the most part to the addition of new liquefaction capacity. Between the end of 2018 and the end of 2019, capacity totaling 58.5 Mt (78 bcm of natural gas) is slated to come onstream (Figure 4). These are substantial volumes, equivalent to 20% of the world’s LNG exports in 2017 (287 Mt, i.e. 382 bcm of natural gas, according to Cedigaz).
Figure 4: Liquefaction units under construction (2018-19)*
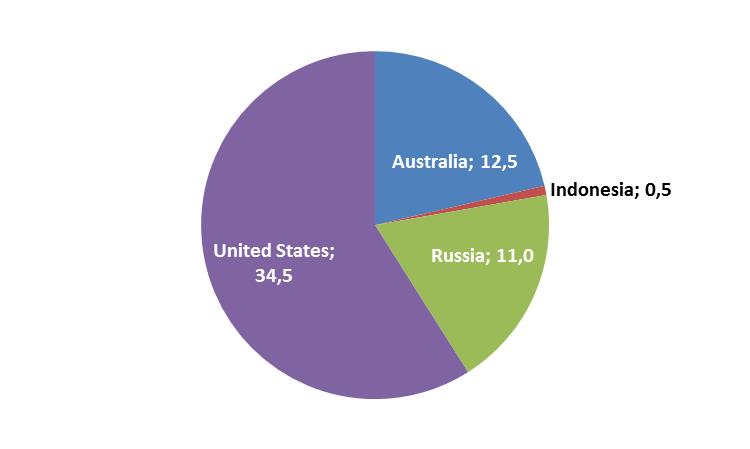 Source: Cedigaz
A look at Chinese LNG imports
In Q2 2018, China’s LNG demand registered a strong increase in the industrial sector now that Beijing is stepping up the pace for projects to convert coal-fired boilers to gas. LNG imports reached 5.4 bcm in May, up 17% compared to the 4.6 bcm noted in April (Figure 5). Imports rose by 52% between Q1 2017 and Q1 2018. China accounted for 78% of the increase in world LNG demand (+14 bcm in the last six months).
China now figures as a major LNG importing country. Its share of world imports has reached 16%, double its 2015 figure. The volumes that it imports are now equivalent to Europe’s and about half those of Japan, which continues to be the top importing country. According to S&P, China’s share of the world’s LNG trade should catch up with Japan’s around 2029.
Figure 5: China’s monthly LNG imports
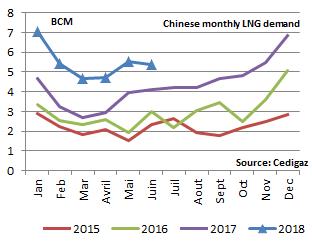 Source: CEDIGAZ
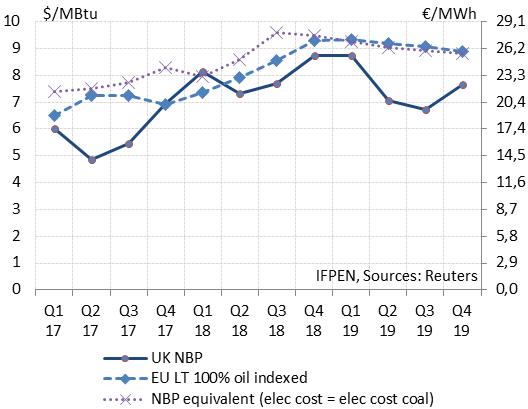
NBP price (UK) under slight pressure
The NBP price stood at €21/MWh ($7.3/MBtu) in Q2, down slightly compared to Q1 but significantly higher than last year’s average for the same period (€15/MWh; $4.9/MBtu – cf. Figure 6). The increase in the oil price and the pressure on the LNG market in Asia seem to be responsible. Market trends indicate a slight upswing for Q3 (€22/MWh; $7.6/MBtu) and a more pronounced increase for Q4 (€25/MWh; $8.5/MBtu). A fairly significant decrease is anticipated for the spring and summer of 2019. This is in line with Asian market forecasts.
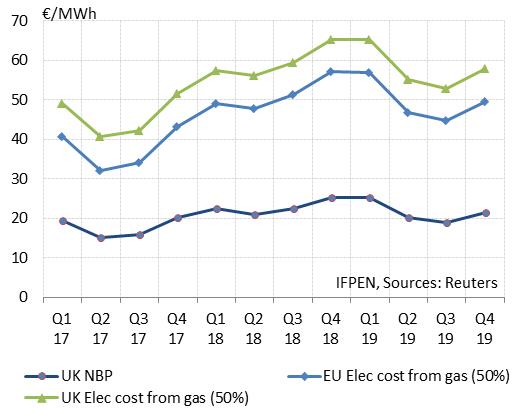
The operating costs (price of energy + C02) for the production of electricity at gas-fired power plants should increase by about €10/MWh between now and next winter, when it is expected to be in the €57-65/MWh range in Europe and the United Kingdom (Figure 7).
|
Figure 6: NBP price
|
Figure 7: NBP price and electricity production costs
|
Influence of the abundant U.S. supply on the LNG market and U.S. gas price
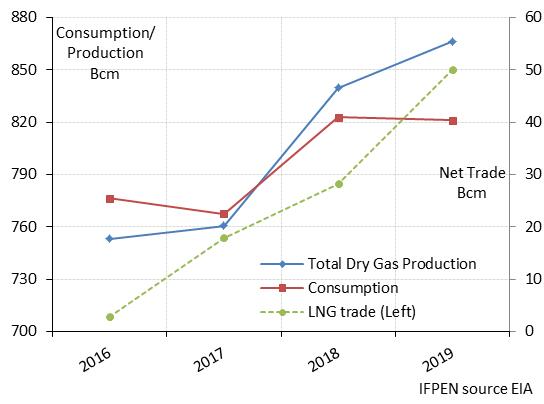
Pressure on the LNG market is expected to slacken in 2019, for which the growth in U.S. LNG exports may be responsible. According to EIA forecasts, annual LNG exports will climb from 30 bcm in 2018 to 50 bcm in 2019 (Figure 8). This increase of 20 bcm is equivalent to half of the increase in world LNG demand in 2017. By year-end 2019, the U.S. will be exporting at the rate of 70 bcm/year. The magnitude of these volumes may explain why the pressure on Asian LNG prices is expected to slacken in 2019 (not accounting for weather variables).
|
Figure 8: U.S. gas balance (2016-2019)
|
Figure 9: Henry Hub price
|
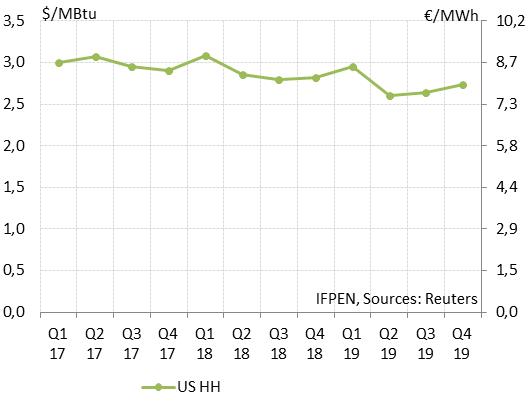
The build-up in U.S. exports of natural gas follows from the large scale of national production. Growth in output will reach 80 bcm in 2018, a large volume that would cover most of the increase in world gas demand (100 bcm in 2017). This accounts for the relatively low level of U.S. prices, expected to hold steady at slightly under $3/MBtu (barring exceptional weather conditions). It is thought that the price may fall even lower, to about $2.6/MBtu, during the spring of 2019 (Figure 9).
A look at U.S. LNG exports
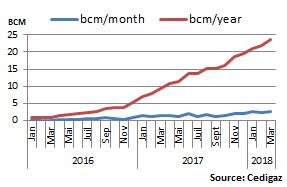
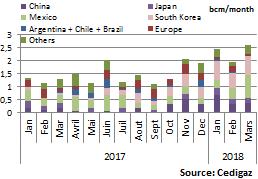
U.S. LNG exports have shown strong growth since 2016 and now stand at between 2 and 2.5 bcm/month (Figures 10 & 11). In 2017, 45% of all exports were shipped to three Asian countries: South Korea, China and Japan. The use of long-term contracts (South Korea) and higher selling prices are the reasons for Asia’s preponderant position. Countries in the Americas represented 30% of the total in 2017, with Mexico accounting for 20%. Europe (14%), with its sustained electricity production demand, was the Number Three importing region.
|
Figure 10: U.S. LNG exports
|
Figure 11: U.S. LNG exports, by destination
|
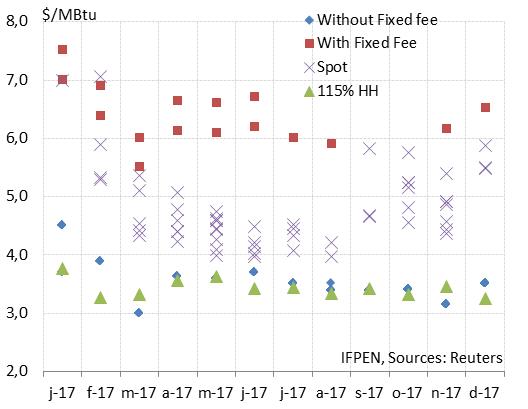
According to EIA data on the selling prices of LNG exports, there are three price categories at U.S. export points: contract prices equivalent to 115% of the Henry Hub price, either with or without a fixed charge (between $2.5 and 3/MBtu), and spot prices somewhere between these two (Figure 12). Shipping costs must be added to the price paid by the importing country.
Figure 12: U.S. LNG sales prices in 2017, by month
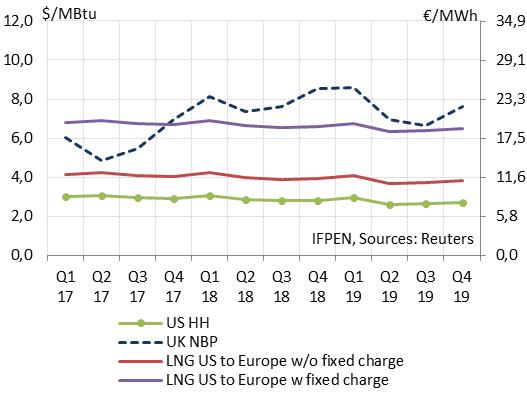
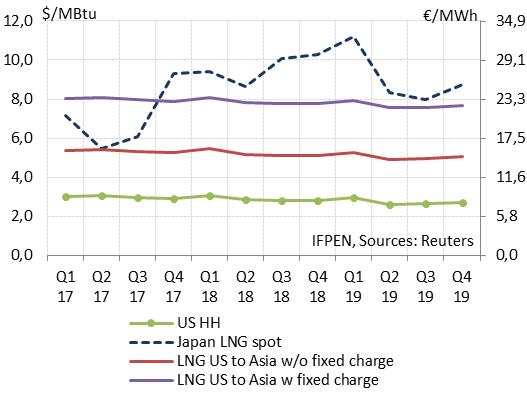
 Based on current data, the comparison of forward gas prices in Europe and Asia with the cost of U.S. LNG (Figures 13 & 14) seems to indicate that U.S. LNG is and will continue to be competitive in 2018 and 2019 in these two regions of the world. Forecasts are anticipating market prices higher than the cost of delivered U.S. gas, even including the fixed charge. This was not the case in early 2017.
|
Figure 13: Cost of U.S. LNG and NBP price
|
Figure 14: Cost of U.S. LNG and gas price in Japan
|
By Guy Maisonnier – Senior Economist – IFPEN
Constancio Silva – Senior Economist – Cedigaz
Cedigaz (International Center for Natural Gas Information) is an international association with members all over the world, created in 1961 by a group of international gas companies and IFP Energies nouvelles (IFPEN). Dedicated to natural gas information, CEDIGAZ collects and analyses worldwide economic information on natural gas, LNG and unconventional gas in an exhaustive and critical way.