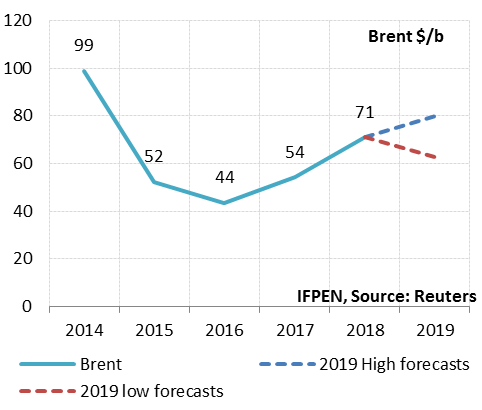
- Brent: between $60 and $80/b in 2019 (2018: $71/b)
The oil price oscillated between $50 and $86/b in 2018, averaging $71/b (+31% compared to 2017). The volatility observed in 2018 was due in large part to uncertainty about supply and economic growth, but also to the U.S. sanctions against Iran. Initially announced as being extremely severe, the embargo was softened at the last minute by the American president when he realized the likely consequences of a rise in the price of oil products.
For 2019, the average Brent price is expected to be in the $60 to 80/b range. These expectations account for different scenarios for factors such as economic growth, the Iran embargo, OPEC’s management of supply and U.S. production.
- NBP: €19-23/MWh in 2019 (€23.3/MWh; $8.1/MBtu in 2018)
Based on forward prices and expected oil prices, the average UK NBP price for 2019 could fall between €19 and 23/MWh ($6.5-7.8/MBtu) compared to €23,3/MWh ($8.1/MBtu) in 2018, representing a potential decrease of between 1 and 18%.
Since 2016, the NBP price has climbed steadily, mainly impelled by the rising oil price. The oil price continues to influence the NBP, especially in winter when demand peaks and makes it necessary to rely more heavily on oil-indexed contracts, including LNG imports. This has not happened so far in 2019: prices have been in the €18-19.5/MWh ($6.0-6.5/MBtu) range, owing to a relatively mild winter in Europe and Asia.
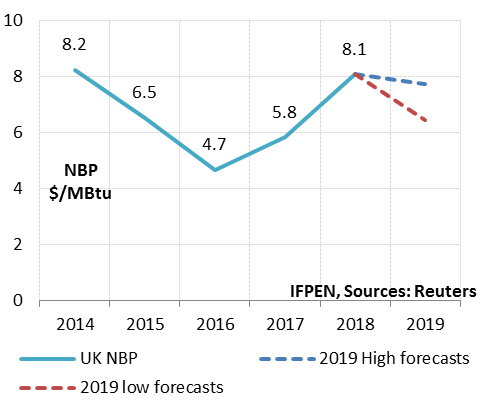
Anticipating an oil price of $60/b, the markets are expecting an NBP of about €17.7/MWh ($5.9/MBtu) for the next six months and €22.4/MWh ($7.5/MBtu) next winter. The annual average for 2019 would be €19/MWh ($6.5/MBtu), which is 18% lower than in 2018. If the oil price nears the $80/b mark, then the NBP could rise to about €23/MWh ($7.8/MBtu), equivalent to its average for 2018.
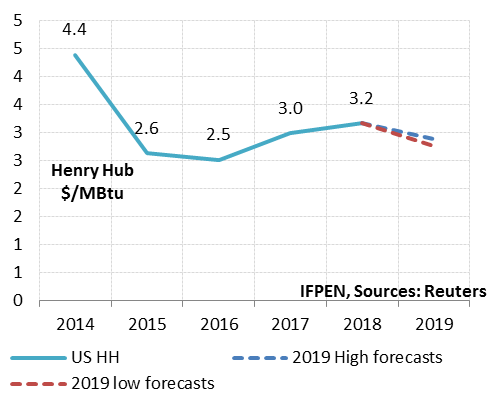
- Henry Hub: $2.8-3.0/MBtu in 2019 ($3.2/MBtu in 2018)
In the United States, the average forward Henry Hub price for 2019 has fluctuated between $2.8 and 3.0/MBtu, which represents a decrease of between 9 and 13% compared to the 2018 average of $3.2/MBtu (€9.2/MWh).
The winter weather conditions drove prices up to particularly high levels in November and December 2018, whose monthly averages both stood at about $4/MBtu (€12/MWh). The Henry Hub price retreated in January to $3/MBtu (€9.2/MWh) and has remained below that level since then. Given the abundance of supply, the futures markets are anticipating prices of about $2.5/MBtu next summer and $3/MBtu next winter. This corresponds to the monthly averages observed since 2015.
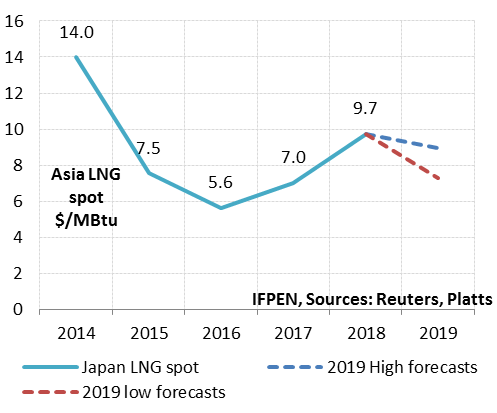
- Spot LNG prices in Asia: $7.3-9.0/MBtu in 2019 ($9.7/MBtu in 2018)
Based on the futures prices and likely oil price trends, the spot LNG price in Asia could average between $7.3 and 9.0/MBtu (€21.8-26.8/MWh) in 2019 versus $9.7/MBtu (€28/MWh) in 2018. This represents a potential decrease of between 5 and 23%.
The oil price has been falling since early October 2018 and Winter 2018-19 has been relatively mild. As a result, the spot LNG price in Asia began a spectacular downswing in November, when it exceeded $10/11 MBtu. It proceeded to fall to $8.4 MBtu in January and $7/MBtu in February. Forward prices are anticipating prices of about $7/MBtu next summer and $8/MBtu next winter. If the oil price nears the $80/b mark, prices could be driven higher to approximate $10/MBtu by year-end.
A look at the U.S. market
- The market in 2018
In 2018, the average spot price for Henry Hub natural gas stood at $3.17/MBtu, up by 18 cents compared to the 2017 average. After the usual winter peak, the price climbed steadily throughout the year, spiked in October and November, then declined towards year-end (Fig. 1).
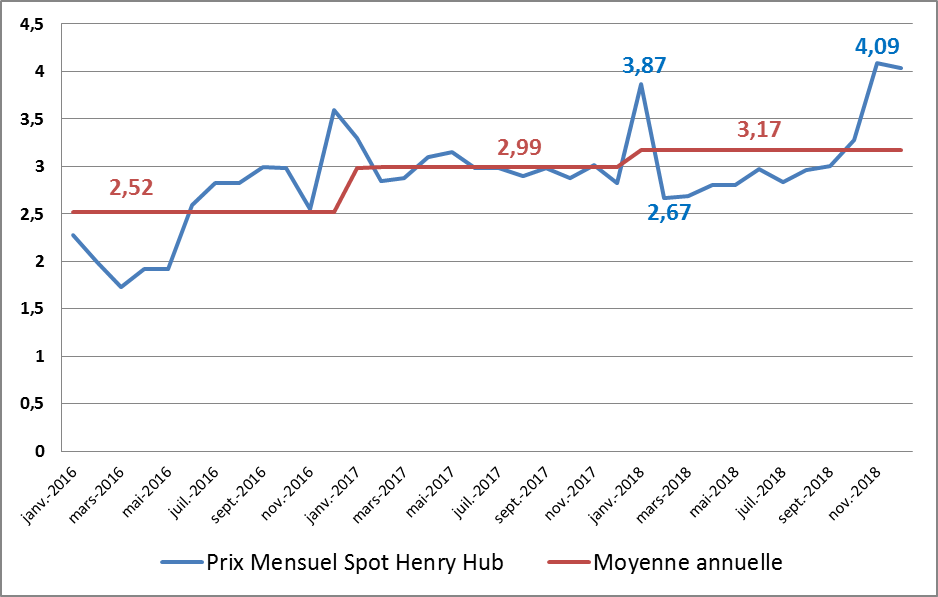
Source: U.S. EIA and DOE, January 2019
Early in 2018, a period of intense cold struck much of the eastern United States. High demand for natural gas, notably for heating purposes, caused the spot price to spike in January (monthly average: $3.87/MBtu).
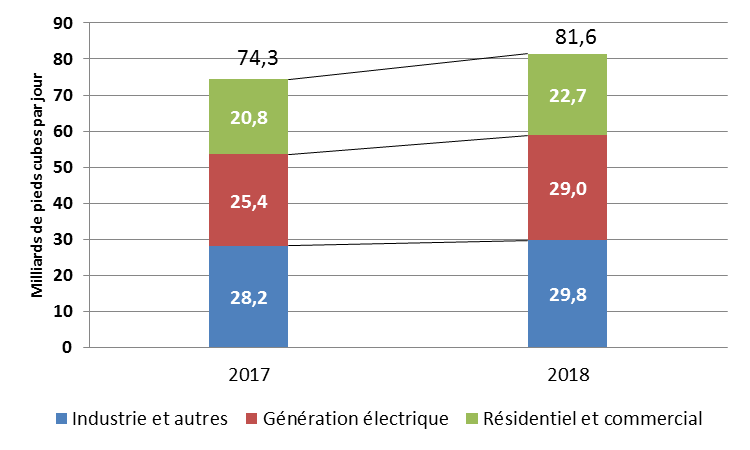
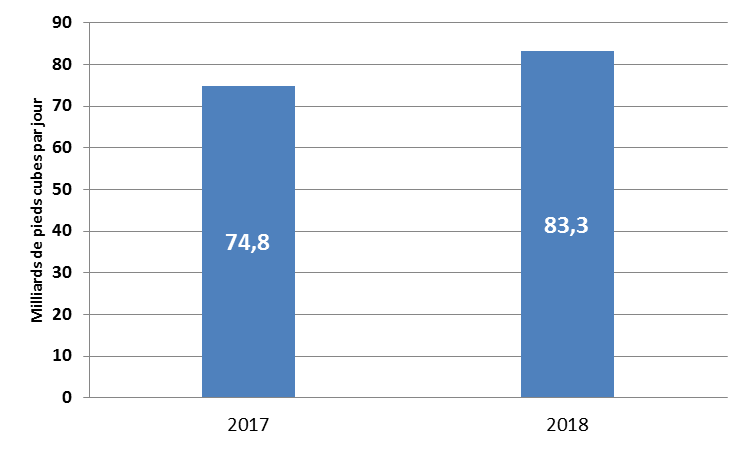
Between February and October, the price rose from $2.67/MBtu to $3.28 $/MBtu. It was under pressure mostly because gas consumption increased significantly in 2018 (Fig. 2) in spite of a strong increase in output (Fig. 3). The rise in consumption was mainly due to the replacement of coal-fired power plants with gas-fired units. Gas consumption in the electricity sector was 14% higher than in 2017. A surge in industrial investment (e.g. for the production of methanol, ammonia and urea-based fertilizers) as well as demand for energy to heat or air-condition physical premises contributed to this annual increase in the industrial (+6%), commercial and residential (9%) sectors.
Figs. 2 and 3: Consumption and production of natural gas, 2017-2018 (estimate) :
 |
 |
This growth in output served to moderate price variations. Production derived mainly from strong activity in the northeastern Appalachian Basin, the Permian Basin in western Texas and New Mexico and the Haynesville Shale plays in Texas and Louisiana.
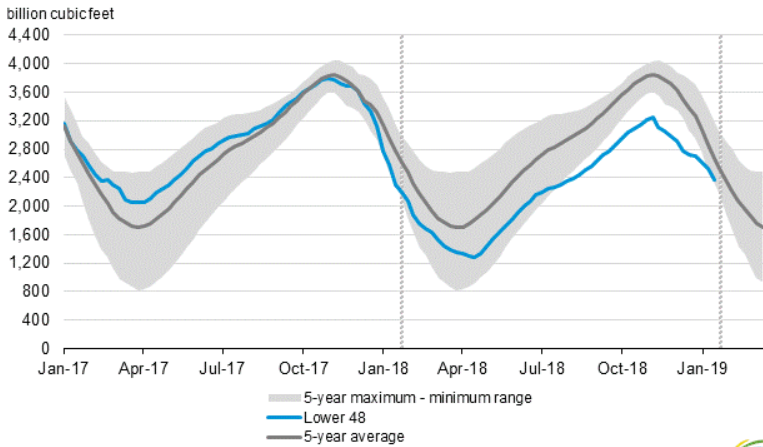
In November, many parts of the United States experienced temperatures below the seasonal norm, sending natural gas prices up again. By mid-November, stocks had been declining for several weeks, which exerted upward pressure on prices (Fig. 4). On November 21, the price reached $4.7/Mbtu, before turning down sharply in December, falling to $2.72/MBtu by early January 2019, temperatures having been higher than usual in the 48 continental states.
Fig 4 : Working gas in underground storage compared with the 5-year maximum and minimum
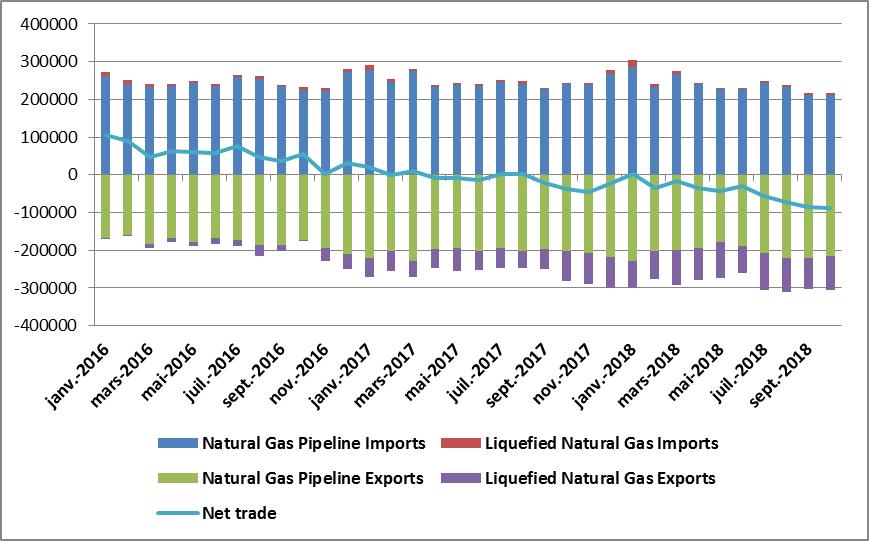
The United States is preparing to be a major player in the world gas trade in the near future. Production currently exceeds domestic demand, a trend that is expected to intensify in the future, according to the Short-Term Energy Outlook (EIA). Seeking to make the most of its gas resources, the U.S. exports its surplus via pipelines towards Mexico and via a series of gas liquefaction terminals, recently brought onstream. It has become a net exporter of natural gas (Fig. 5).
In 2018, thanks to the addition of cross-border pipe capacity, gas exports piped towards Mexico picked up starting in the first quarter (+19.5% between February and October). Capacity has also been increased at the LNG export installations at the Sabine Pass terminal in Louisiana (Train 1 to 4, total capacity: 18 Mtpa). Commercial activities have also started up at the Cove Point LNG terminal in Maryland (5.25 Mtpa) and the Corpus Christi terminal in Texas (Train 1, 4.5 Mtpa). These developments have all contributed to the expansion of U.S. LNG exports.
Fig 5 : Imports/exports of natural gas, per month
- Near-term energy prospects
In its “Short-Term Energy Outlook” (STEO) for January 2019, the EIA anticipated that the market trends observed in 2018 – i.e. relative stability of the Henry Hub price, a strong increase in gas production and gas exports, and consumption showing relative growth – would continue in 2019 and 2020.
The EIA expects the Henry Hub benchmark price for natural gas to average $2.89/MBtu in 2019 and $2.92/MtBu in 2020, about 27 cents less than the 2018 average of $3.17/MBtu. According to STEO forecasts, the price should be comparable to those reported for the last few years, because output is increasing more or less on a par with growth in demand and exports. The futures prices on NYMEX on January 22 ranged from $2.8 to $3.0/ MBtu.
According to U.S. gas production forecasts, there will be sustained growth until 2020, trending upward from an estimated 83.3 bcm/d in 2018 to 90.2 bcm/d in 2019, then 92.2 bcm/d in 2020. Several factors are driving this uptrend, such as improved drilling efficiency and a correlative reduction in drilling and well completion costs, as well as increased gas transportation capacity serving resource-rich areas like the Appalachians or the Permian Basin.
According to the STEO, total natural gas consumption in the U.S. should remain relatively stable compared to 2018 levels, rising by 1.3% in 2019 and 1.1% in 2020 to reach a total of 83.6 bcf/d in 2020. Gas consumption is expected to go down slightly in the residential and commercial sectors and go up in the electricity and industrial sectors, where the replacement of coal by natural gas is ongoing. Natural gas will remain the main source of U.S. electricity production, with a market share expected to rise from 35% in 2018 to 37% in 2020 while that of coal declines (dropping from 28% in 2018 to 24% in 2020).
In the medium term, LNG will be the main source of gas exports, thanks to a major investment program, which got underway in 2016 when the Sabine Pass terminal was brought onstream. The most advanced projects, expected to start operating in 2019, are the Cameron LNG and Freeport LNG terminals on the Gulf Coast, the Elba Island LNG terminal in Georgia, Sabine Pass and Corpus Christi, representing total capacity of 32 Mtpa. The EIA expects that LNG exports will grow from about 3.0 bcf/d in 2018 to 5.1 bcf/d in 2019, reaching 6.8 bcf/d in 2020 (more than double the figure for 2018).
A look at the world LNG market in 2018
- LNG imports
World LNG imports rose by 8% in 2018 (+23Mt year on year), reaching 310 Mt by year-end. The bulk of the increase was concentrated in three countries: China (+16 Mt), South Korea (+6.6 Mt) and India (+3.4 Mt ). The reasons for this trend were coal-to-gas substitution in China, unusually high temperatures and lower nuclear energy production in South Korea.
Fig 1: Variations in the level of imports (net of re-exports)
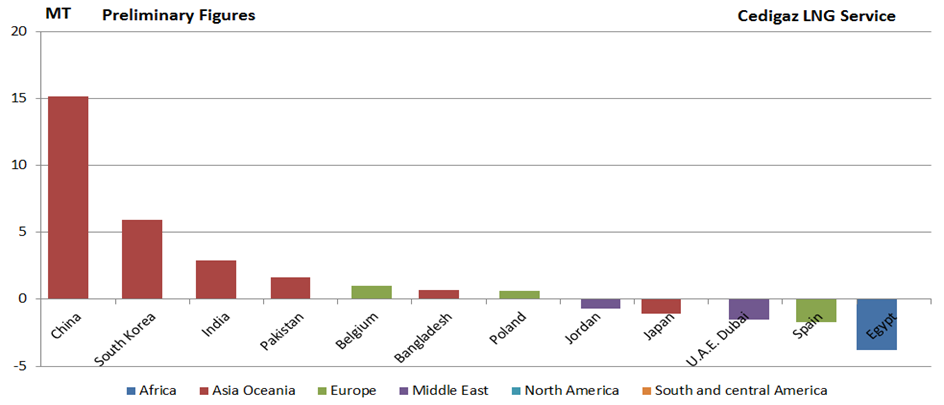
In other regions of the world, imports were down, especially in the Middle East (-2.5 Mt) and Africa, mainly in Egypt (-3.7 Mt/yr). In Europe, the growth of net LNG imports was curbed by a rally in reload activity this year, totaling 4.5Mt of LNG (3.5 times the 2017 figure), including 2 Mt in France.
- LNG exports
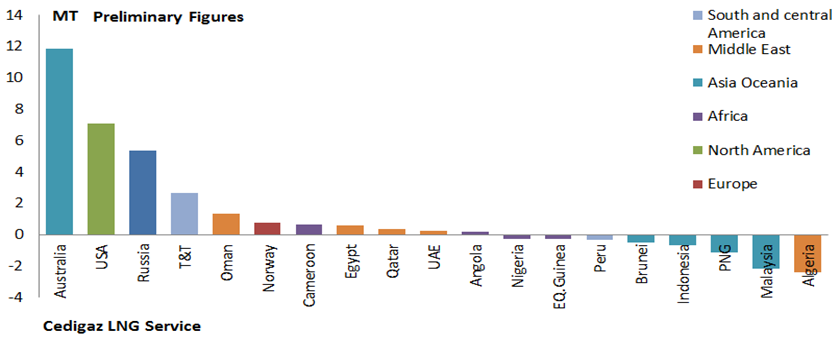
On the supply side, Australia (+12Mt), the United States (+7Mt) and Russia (+5Mt) contributed the bulk of growth in 2018, mainly because projects in the U.S. and Australia were ramping up. Another reason is the startup of new units such as Wheatstone LNG (Train 2) and Ichthys LNG (Trains 1 & 2) in Australia, Dominion Cove Point (Train 1) in the U.S. and Yamal LNG (Trains 1 & 2) in Russia.
Moreover, the rise in output (+ 2.5Mt) at the LNG terminal in Trinidad and Tobago should be duly noted. This turnaround in production, which had been declining since 2014, was due to the startup of production at Juniper Field.
In Asia and Africa, however, LNG exports from Malaysia, Papua New Guinea and Algeria have declined as a result of maintenance shutdowns.
Fig 2.: Trend in supply for 2018
- The LNG price
Several factors influenced the LNG price trend in 2018. During the first nine months, the LNG market was tight due to strong Asian demand and a lower-than-expected global supply. The LNG spot prices in Northeast Asia neared the $11.5/MBtu mark in September. This stepped up the pace of re-exports from Europe, given the favorable price spread ($4/MBtu in June). The rise in the LNG price was also sustained by that of the coal price (+12%) and crude price (+40% for the same period), knowing that the oil price influences a large proportion of long-term contracts.
In the last quarter of 2018, the spot price in Northeast Asia fell by 25% to about $9/Mbtu, reflecting the downtrend in the oil price. The substantial decrease in the LNG price was also due to higher-than-average winter temperatures that curbed demand in Asia, thus helping to relieve pressure on the LNG market.
In 2019, world liquefaction capacity should gain 35 Mt, thanks in particular to the new units in the United States. It is likely that these additional volumes will relieve pressure and help create a buyers’ market. The relatively low level of futures prices lends credence to this scenario, at least for now.
_________________________________________
[1] 2019 prices are based on historic prices and futures quotation, so they are not forecasts, but anticipated prices subject to variations due to economic, climate-related or geopolitical factors.
By Guy Maisonnier – Senior Economist – IFPEN
Constancio Silva – Senior Economist – Cedigaz
Amit Singh Rao – Junior Economist – Cedigaz
Cedigaz (International Center for Natural Gas Information) is an international association with members all over the world, created in 1961 by a group of international gas companies and IFP Energies nouvelles (IFPEN). Dedicated to natural gas information, CEDIGAZ collects and analyses worldwide economic information on natural gas, LNG and unconventional gas in an exhaustive and critical way.