- International spot prices have pursued a phenomenal decline in the first five months of the year due to the combined effects of milder weather, COVID-19 driven demand destruction and the ongoing LNG overhang leading to record-high storage levels.
- In the second quarter of 2020, the lockdown-induced demand shock combined with LNG oversupply pushed international spot prices to new record lows.
- Preliminary estimates indicate that world LNG supply weakened in the second quarter, mainly due to the downward flexibility of US LNG.
- LNG is being supplied to Europe at a discount vs. oil-indexed contract prices. Given the extent of oversupply in the LNG market, major pipeline gas suppliers are losing market share.
- The US has been the only market to reduce LNG production in a significant manner in response to the weakening of international LNG prices in the second quarter, emerging as a marginal or “swing” supplier for the global LNG market.
- The forward curve suggests prices facing continued downward pressure throughout the summer, despite a likely decline in world LNG supply.
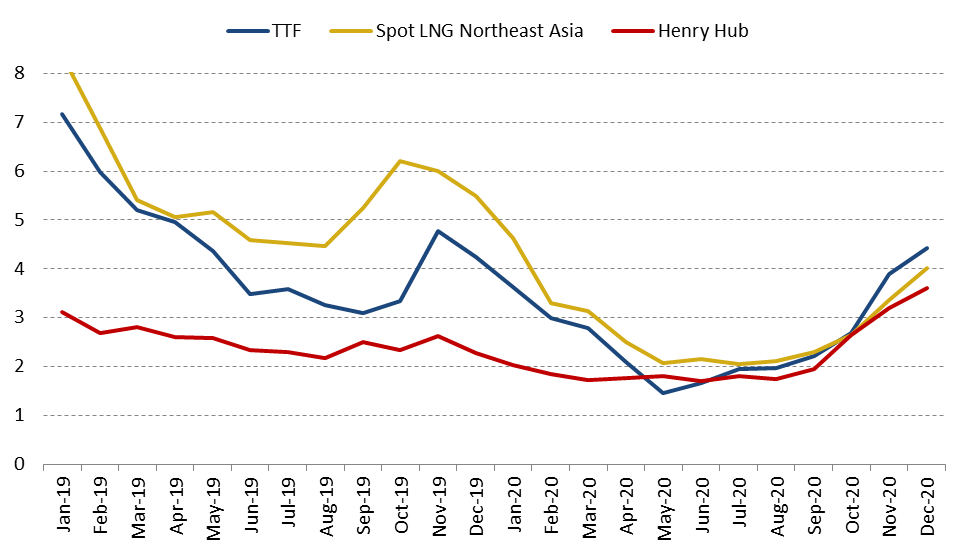
Evolution of international spot gas prices
In the second quarter, European spot prices pursued their decline to reach new record lows in May. On 21 May 2020, the TTF price plunged 25% to break an historical low of just below 1$/MBtu. This trend reflected the lockdown-induced demand shock in Europe and the ongoing LNG oversupply which motivated higher-than-average net storage injections. At the end of June, European storages were 80% full, an historic high rate at this time of year.
In the first five months of the year, European gas demand (Turkey excluded) is estimated to have declined by 8% (Source: OIES), due to the combined effects of the warm winter, the expansion of renewables in the power mix and the coronavirus-driven demand slump.
European spot prices slightly recovered in June when traders reported less cargo availability in the Atlantic Basin as the impact of US cargo cancellations started to show up. From the 22 April to 12 June, TTF traded at a discount to the US Henry Hub. Because of negative US LNG netbacks which have been anticipated to remain in negative territory for the rest of the summer, US LNG feed gas flows fell by 23% from April to May, and by 43% from May to June, despite the start-up of commercial operations at Freeport Train 3 in May. In the second quarter, it is estimated that around 130 US LNG cargoes were cancelled.
Figure 1 : Evolution of international spot gas prices ($/MBtu)
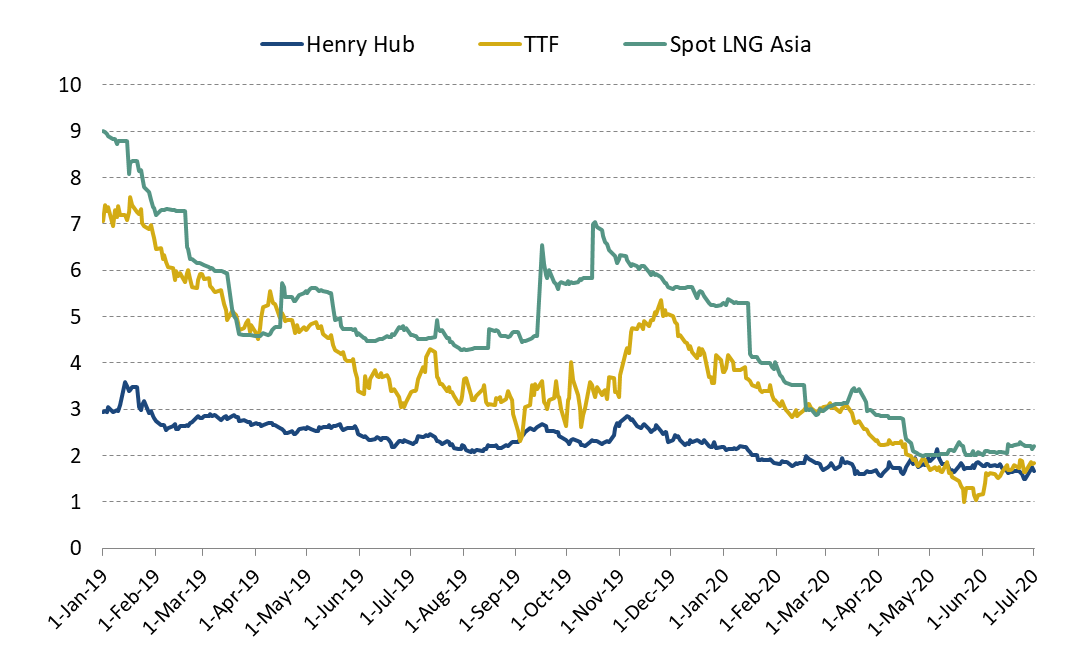
Source: Reuters, IFPEN, Cedigaz Analysis
In May, US LNG exports were 25% (-1.3 Mt) below the January figure, a much steeper decline than for Qatar (-0.7 Mt/-9%) and Australia (-0.7 Mt/-10%). These recent developments show that the US is well- positioned to stand as the marginal or “swing” LNG supplier because the US liquefaction model makes it much easier to shut in US cargoes than traditional Take or Pay LNG contracts.
The TTF price gained 50% in June and near-curve prices also rose sharply, reflecting a strong volatility and a great level of uncertainty which is heading into this summer.
Northeast Asian spot prices have continued to fall in April, sliding to historic low of just under 2$/MBtu at end-month, before staying in a 2-2.3 $/MBtu range afterwards. They have inched up recently, supported by incremental summer and optimization demand (opportunistic buying). In this context, China has been the main buyer supporting prices.
Henry Hub prices remained depressed, facing pressure of growing supply and weak demand amid mild weather conditions. The Henry Hub price remained weak in the second quarter and declined further to 1.6$/MBtu on average in the second half of June. The price collapsed to a 21-years low of 1.4$/MBtu on the 25th June. This recent trend may have been driven by the changing global LNG market conditions, as US feed gas to LNG plants was dramatically reduced in response to the fall of international spot prices.
The tightening of price spreads reduced arbitrage opportunities and even resulted in negative netbacks for certain suppliers, noteworthy the US.
Evolution of oil-indexed contract prices
In the second quarter, the oil-indexed LNG contract price did not experience a noticeable fall as they had been not yet impacted by the collapse of the oil price during March and April. However, this latter should be felt significantly in the third quarter, as low oil prices filter through the price-setting reference period, at least 3 months ahead. But lower oil-linked prices further down the curve continued to provide an incentive to seek cheaper spot LNG cargoes.
Oil-indexed contract price remain predominant in Asian LNG portfolio (Japan, Korea, China…), whereas the European gas market is much less affected by the oil price dynamics.
Figure 2: Evolution of the Japan LNG price versus JCC ($/MBtu)
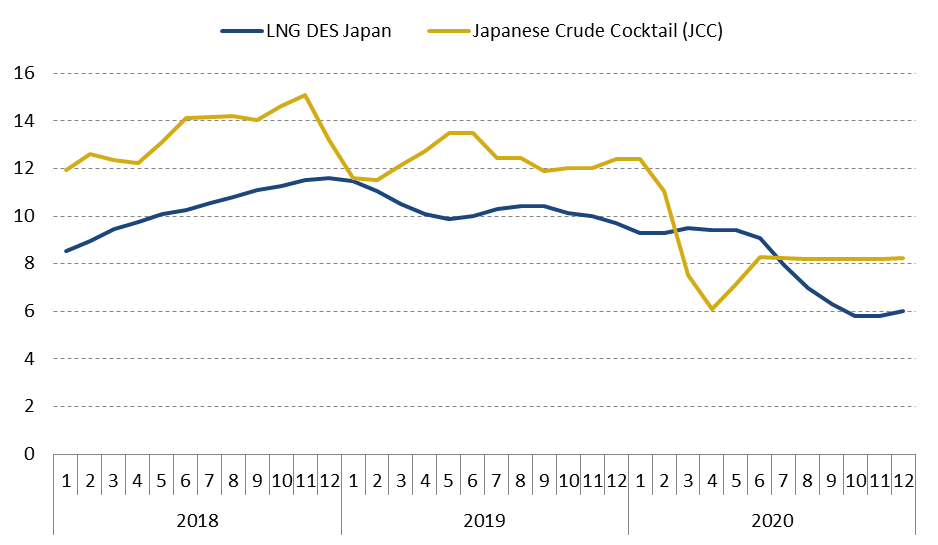
Source: Cedigaz analysis
Recent developments on the global LNG market
After surging 12% to a new record of 96 Mt in the first quarter, according to Cedigaz, global LNG supply declined in the second quarter, marking a turnaround after a continuous growth since 2015.
Indeed, Q2 estimates show that the COVID-19 had a more visible and negative impact on the global LNG market from mid-March, as the virus spread to most countries. LNG supply in April 2020 was 2.2% lower than in April 2019. Cedigaz’ data also indicate that world LNG supply was marginally lower in May 2020 than in May 2019, with European LNG imports’ growth offsetting declines in every other region. Europe’s LNG imports continued to grow year on year in April (+ 6%) and May 2020 (+ 15%) but the increase was much lower than the growth in the first quarter (+ 25%). Some preliminary estimates for June also indicate a fall in global LNG supply, with major exporters (United States, Russia…) reducing LNG exports, except Qatar, which benefits from highest netbacks.
Figure3: Evolution of global LNG supply (Mt)
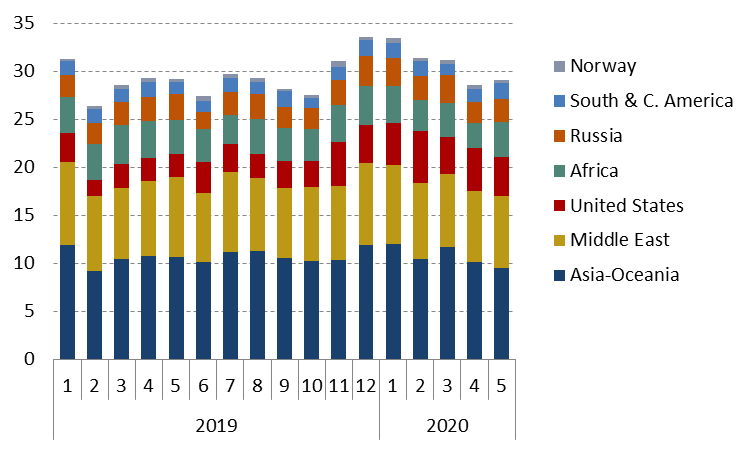
Source: Cedigaz
Short-term trends in European gas supply
LNG is being supplied at a discount to pipeline gas. Russian and North African gas volumes have been the first victims of the LNG glut and import volumes from these sources have been cut. Russian pipeline gas deliveries to Europe have fallen strongly, as Gazprom’s long term contracted gas supply, which remains partly oil- indexed, has been sold at a premium to TTF. LNG delivered prices holding at a discount to the cost of oil-indexed Algerian pipeline supply have also incentivised Spain and Portugal to displace Algeria’s pipeline gas with LNG. Norway’s pipeline gas exports also fell strongly, but to a lesser degree. In total, Cedigaz estimates that total pipeline gas exports to Europe (Turkey excluded) fell by almost 20% year-on-year in the first half of 2020.
Figure 4: Total monthly average pipeline flows to Europe (Bcm)
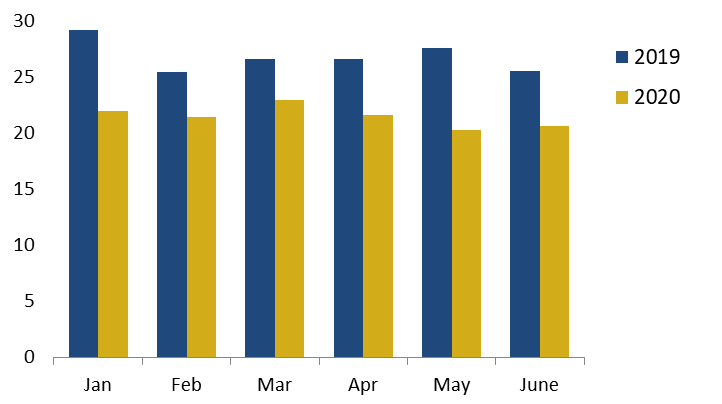
Source: Cedigaz
Prospects for international spot prices
Forward curves suggest that Asian and European spot prices may remain suppressed. Despite the cancellation of US LNG cargoes due to negative margins for US LNG, any potential upside may be capped by ample supply and demand uncertainty in both Europe and Asia through the summer. In Europe, storages are expected to reach full capacity in early August and the amount of gas stored may be significantly higher than in 2019 for the rest of 2020. For the second half of 2020, European and Asian spot prices are anticipated to be 45%-50% below the second-half 2019 level.
Figure 5: Short-term evolution of monthly international spot prices ($/MBtu)
Source: Reuters, Cedigaz Analysis
Armelle Lecarpentier, Chief Economist, CEDIGAZ
Cedigaz (International Center for Natural Gas Information) is an international association with members all over the world, created in 1961 by a group of international gas companies and IFP Energies nouvelles (IFPEN). Dedicated to natural gas information, CEDIGAZ collects and analyses worldwide economic information on natural gas, LNG and unconventional gas in an exhaustive and critical way.