- In the summer 2020, international spot prices recovered strongly after months of depression. In September, European and Asian spot prices were more than twice the level of June.
- This unexpected bullish run was mainly due to a supply cutback as global LNG supply reduced more than previously anticipated. In addition to the US, which has emerged as a swing supplier, many large LNG exporters reduced exports in response to weak demand and gas prices.
- Global LNG supply had started to shrink in the second quarter (- 2% yoy) and preliminary estimates indicate that world LNG supply declined even more strongly in the third quarter, down 5% yoy, with the US and Australia leading the way.
- On the demand side, Europe, China and India have seen a recovery in gas demand. This demand uptick also helped support spot gas prices. China, where gas demand has rebounded, has been the main buyer supporting spot LNG prices.
- The forward prices indicate that this bullish trend will continue. However, strong uncertainties remain as spot prices have recently shown a great volatility and sensitiveness to unexpected events on the LNG market.
Evolution of international spot prices
International spot prices started to strengthen in July, driven by a recovery of gas demand in key consuming markets (US, EU, China, India) and tightening supply in most of large Asian producers, especially in Australia, where Gorgon T2 was closed for maintenance.
Asian and European spot prices then spiked in August, jumping by respectively 45% and 60% from July.
The spike of the TTF price occurred as concerns mounted over a potential supply tightening in September and October following the wave of US cargo cancellations. A strong recovery of gas demand in Europe, which was driven by coal-to-gas switching in power generation amid competitive gas prices and a higher CO2 price also contributed to higher prices.
In Asia, spot prices rose on stronger European Hub prices and were mainly buoyed by higher demand from China and technical issues at Australian LNG plants (Prelude, Gorgon).
In the US, Henry Hub rose by 30%, reflecting a growing production/demand gap, mainly due to lower supply from associated gas in the Permian.
Figure 1: Evolution of international spot gas prices ($/MBtu)
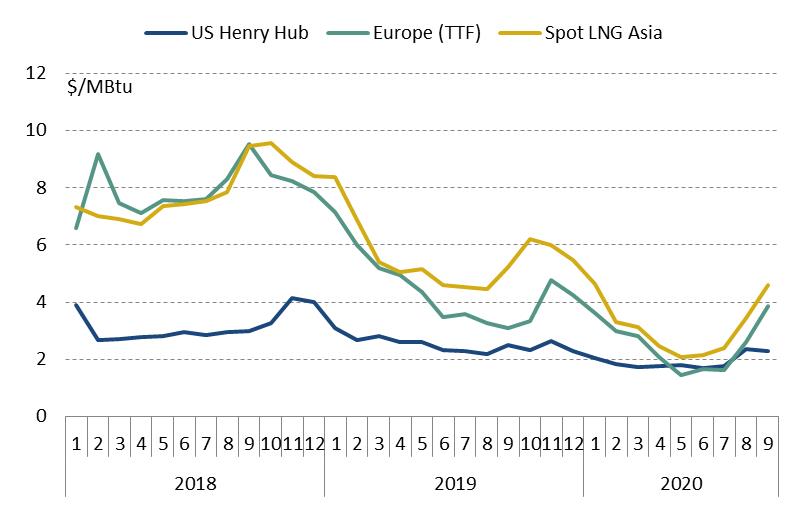
Source: CEDIGAZ LNG Service, preliminary estimates
Spot prices across Europe and Asia extended gains in September, on tightening LNG supply with new concerns over potential cargo losses from the temporary closure of the Sabine Pass and Cameron LNG plants in the US (after hurricanes). In Europe, TTF jumped almost 50% to 3.9 $/MBtu, exceeding last year’s price level for the first time in 2020.
The Henry Hub price fell in the second half of September, amidst hurricanes and wild storms, hitting LNG supply and domestic gas demand.
The widening of price differentials between the Henry Hub and spot prices across Asia and Europe improved netbacks for certain suppliers and made US LNG exports profitable again. In September, US feedgas supplied to LNG plants and gross LNG exports returned to growth.
Evolution of oil-indexed contract prices
In the third quarter, the oil-indexed LNG contract price declined, reflecting the impact of the collapse of the oil price during March and April. Oil-indexed prices thus moved down in the opposite direction to spot prices, softening towards 6$/MBtu, as the lower oil prices of Q2 filter through the long-term import contracts whose the price-setting reference period lasts at least 3 months.
Oil-indexed prices have delinked from spot LNG prices in Asia. As oil-indexed contract price remain predominant in Asian LNG portfolio (Japan, Korea, China…), the average Asian import LNG price fell in the third quarter despite spot prices spiking in August. Due to the several month lag, the mid-year recovery in oil prices is not expected to be reflected in oil-indexed contract prices until December, depending on contractual arrangements. The Japan average LNG import price is expected down 24% to 8$/MBtu for the full year 2020.
Recent developments on the global LNG market
Global LNG supply continued to fall in the third quarter, down 9% yoy in July and 5% in August. The US LNG plants, which were the most impacted by the first-half slump of spot prices, made the largest supply cuts during the summer as reflected by the low utilization rates of US terminals, which averaged only 33% in July. Some preliminary estimates for September indicate that global LNG supply declined slightly and by a much narrower margin than in previous months, mainly because of less US cancellations.
Figure 2: Evolution of global LNG supply (000 t)
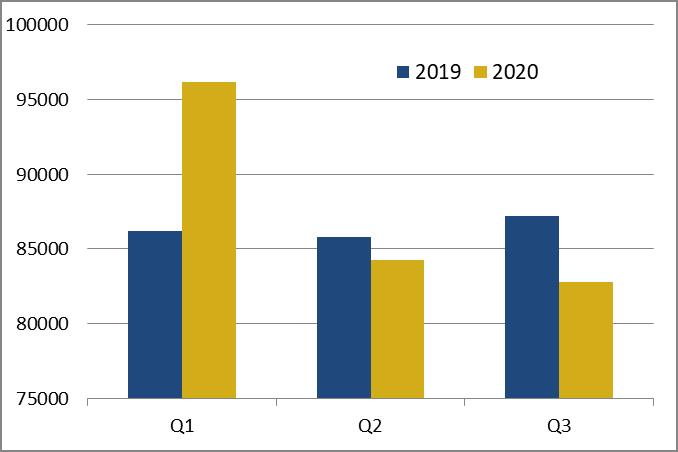
Source: CEDIGAZ LNG Service, preliminary estimates
In the third quarter, European LNG imports weakened year-on-year, driven down by Spain, where demand destruction may have been caused by a spike in new Covid-19 infections, as well as stronger hydroelectric output that pared gas-fired generation. Reversely, LNG demand has rebounded in China and slightly recovered in India, driven by declining domestic production and low LNG prices which encouraged consumption for industrial and power uses.
2020 prospects for international spot prices
The forward curve suggests a return to the familiar winter contango structure. Prices in Europe in particular are expected to extend gains, making this market more attractive for US LNG suppliers for the coming winter. In Asia, China will be key to driving spot prices as LNG imports are expected to keep growing towards an expected cold winter.
However, global fundamentals remain bearish. Ample production capacity and deferred cargoes from earlier Covid-19 lockdowns in some countries may increase supply. The price upswing could encourage more supply offers as some LNG exporters are likely to react to the recent price rally to deliver more cargoes.
Market evolutions in recent months have shown that prices are strongly reactive and sensitive to temporary and short variations in LNG supply. LNG production can ramp up quickly if new LNG demand emerges and prices remain attractive.
Figure 3: Short-term evolution of monthly international spot prices ($/MBtu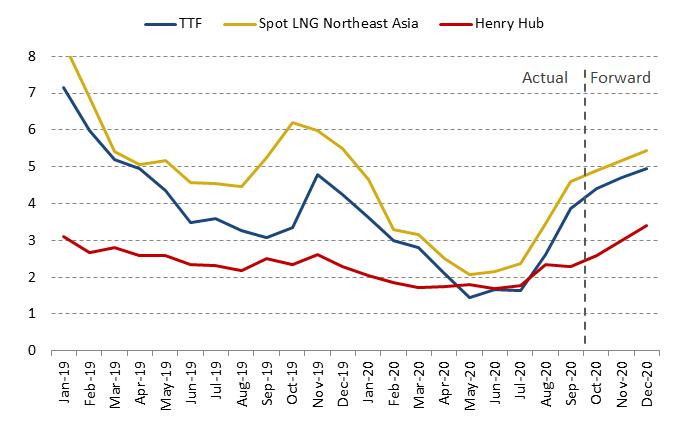 Source: Reuters, Cedigaz Analysis
Armelle Lecarpentier, Chief Economist, CEDIGAZ
Cedigaz (International Center for Natural Gas Information) is an international association with members all over the world, created in 1961 by a group of international gas companies and IFP Energies nouvelles (IFPEN). Dedicated to natural gas information, CEDIGAZ collects and analyses worldwide economic information on natural gas, LNG and unconventional gas in an exhaustive and critical way.