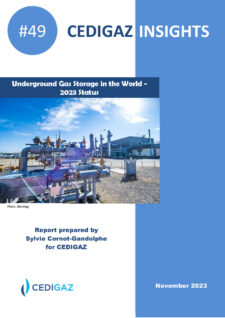
Underground Gas Storage in the World - 2023 Status
| Non Member | 990 € | |
| Member | FREE | Login |
The CEDIGAZ 2023 report highlights significant shifts in the global gas market, with a 1.3% increase in Underground Gas Storage (UGS) capacity, driven by the global gas crisis. Major contributors include China and Europe, with a focus on expanding storage in rapidly developing markets like the Middle East. The report notes a 20% growth in UGS projects in 2022, reflecting the sector's growing importance in natural gas supply security.
The global energy crisis, especially due to Russia's invasion of Ukraine, has reshaped the gas market, leading to more flexible and price-sensitive LNG trade. Governments globally are focusing more on natural gas security, introducing stricter storage regulations and strategic LNG reserves. Japan proposed an international cooperation framework to enhance LNG security.
Europe's RePowerEU plan, a response to Russian aggression, seeks to lessen reliance on Russian fossil fuels, mandating higher gas storage levels. In 2022, storage exceeded EU regulations, reaching 95% by November. Other regions, including Ukraine, the US, China, and the Middle East, are also advancing in UGS, adapting to their specific market needs.

UNDERGROUND GAS STORAGE IN THE WORLD - 2020 STATUS
| Non Member | 150 € | |
| Member | FREE | Login |
The dramatic developments in gas markets in 2019-2020, with an acute oversupply situation due to the negative impact of the COVID-19 pandemic on demand and compounded by the massive increase of LNG supply from the US has stressed the fundamental importance of European Underground Gas Storage, assisted by Ukrainian UGS, to alleviate the imbalance of global gas markets. While until recently, UGS has mainly been developed in North America, Europe and the C.I.S., China is now on the fast lane for storage development. Russia, although the second global UGS capacity holder is still developing its storage infrastructure to serve both domestic and export markets.
This new report by CEDIGAZ provides an insightful review of storage activity in 4 key markets in 2020 and highlights the crucial role of UGS in balancing the global gas market as well as increasing security of gas supply in the context of rising geopolitical risks and trade tensions. The report also includes data on operating, under construction and planned facilities detailed by country.

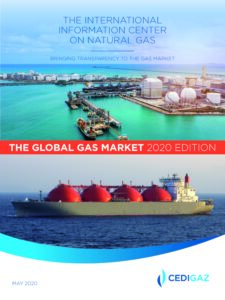
THE GLOBAL GAS MARKET 2020 EDITION
The demand for natural gas continued to display sustained growth in 2019 (+2.3%), to the detriment of coal. This growth is lower compared to the two previous years but in line with the historic 10-year average.
The main factor was the competitiveness of gas in a context of oversupply which encouraged switching from coal in the power and industry sectors, chiefl y in the United States and the EU.
As a result, the share of gas in the energy mix continued to rise. Today, this share is estimated to be 23%, compared to 21% in 2010. Recent developments suggest that the power market has embraced the energy transition through a growing role of natural gas and renewables.
The US remained the largest contributor to both supply and demand growth thanks to the abundance of low-cost shale and associated gas resources. US gas production continued to increase in 2019 at a much faster rate than consumption, thereby creating a large surplus destined for exports.
China was the second largest demand growth area again, even if the expansion of gas demand slowed to 8.6% in a context of weaker economic growth and the relaxation of Chinese policy on coal-to-gas switching.
International trade (net fl ows) expanded strongly by almost 4% only due to the growing abundance of highly competitive LNG supply which displaced pipeline gas, especially in Europe. LNG demand growth slowed in Asia, while Europe absorbed much of the surplus LNG, acting as a balancing market.
As global natural gas supply growth largely outpaced demand growth, a significant amount of natural gas was injected into storages. In a context of LNG overhang, spot prices on the Asian and European markets plunged by more than 40% compared to 2018. New pricing and trading patterns reshape the global gas market which increasingly relies on spot-priced and fl exible gas supply.

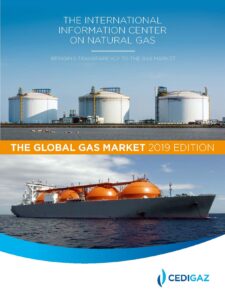
THE GLOBAL GAS MARKET 2019 EDITION
2018 has been a remarkable year for the global natural gas market. Global natural gas demand surged 4.7% to 3,850 bcm, driven by the US and China. The US was the standout performer, accounting for 45% of the global increase in both the consumption and supply of natural gas.
2018 marks the second year of strong growth of natural gas demand, after a 3.5 % rise in 2017. It also recorded the highest growth of gas demand since the post-crisis rebound of 2010.
This fast expansion was driven by the abundance of competitive gas supply, especially in the US and in Russia and by supportive energy and environmental policies, in some countries, particularly in China. Investment in transport infrastructure also contributed to bolster gas penetration in key markets.
China became the largest net importer of natural gas in the world before Japan. Chinese net imports jumped by 32% and accounted for more than 80% of the global increase in net imports, once again highlighting the crucial role of China in absorbing global gas production.
Like in 2017, the expansion of natural gas demand was part of a substantial global growth in world energy demand, driven by a robust global economy and extreme weather conditions.
Strong gas demand growth in Asia contributed to a rise in market prices in key areas and prevented the formation of a global LNG bubble.


