Natural gas supply and demand grew at their fastest pace since 2010
 According to CEDIGAZ report “The Global Gas Market – 2019 Edition”, 2018 has been a remarkable year for the global natural gas market.
Global natural gas demand surged 4.7% to 3850 bcm, driven by the US and China. The US was the standout performer, accounting for 45% of the global increase in both the consumption and supply of natural gas.
2018 marks the second year of strong growth of natural gas demand, after a 3.5 % rise in 2017. It also recorded the highest growth of gas demand since the post-crisis rebound of 2010.
This fast expansion was driven by the abundance of competitive gas supply, especially in the US and in Russia and by supportive energy and environmental policies, in some countries, particularly in China. Investment in transport infrastructure also contributed to bolster gas penetration in key markets.
China became the largest net importer of natural gas in the world before Japan. Chinese net imports jumped by 32% and accounted more than 80% of the global increase in net imports, once again highlighting the crucial role of China in absorbing global gas production.
Like in 2017, the expansion of natural gas demand was part of a substantial global growth in world energy demand, driven by a robust global economy and extreme weather conditions.
Strong gas demand growth in Asia contributed to a rise in market prices in key areas and prevented the formation of a global LNG bubble.
DEMAND RECORDED AN EXCEPTIONAL GROWTH, DRIVEN BY THE US AND CHINA
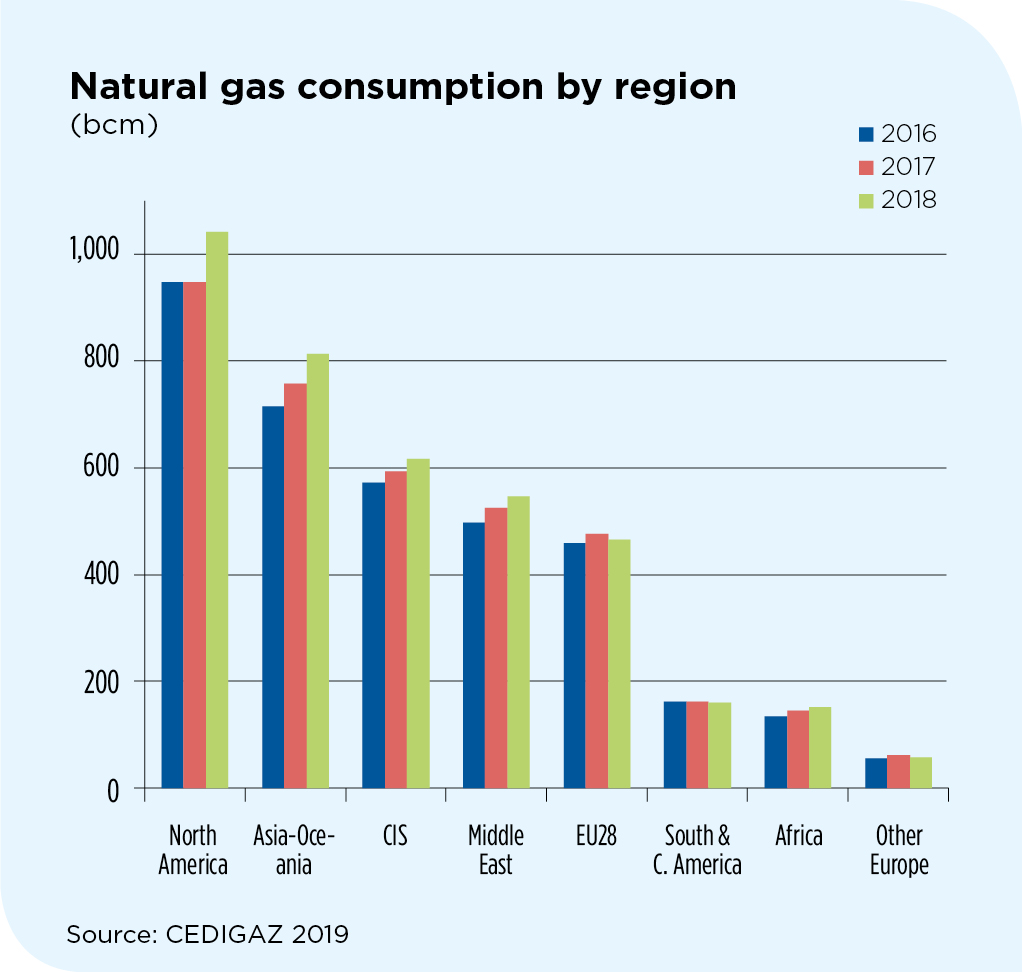
Global gas consumption grew by 4.7% to 3,850 bcm, pursuing the acceleration initiated in 2017. Demand was boosted by a conjunction of weather, economic and policy factors. More than 45% of the global growth in gas demand occurred in the US, where extreme weather conditions lifted electricity demand and residential gas consumption.
Gas demand in China, up 40 bcm, spurted for the second year in a row driven by coal-to-gas switching policies. Demand was also well above average in India, Russia and the Middle East.
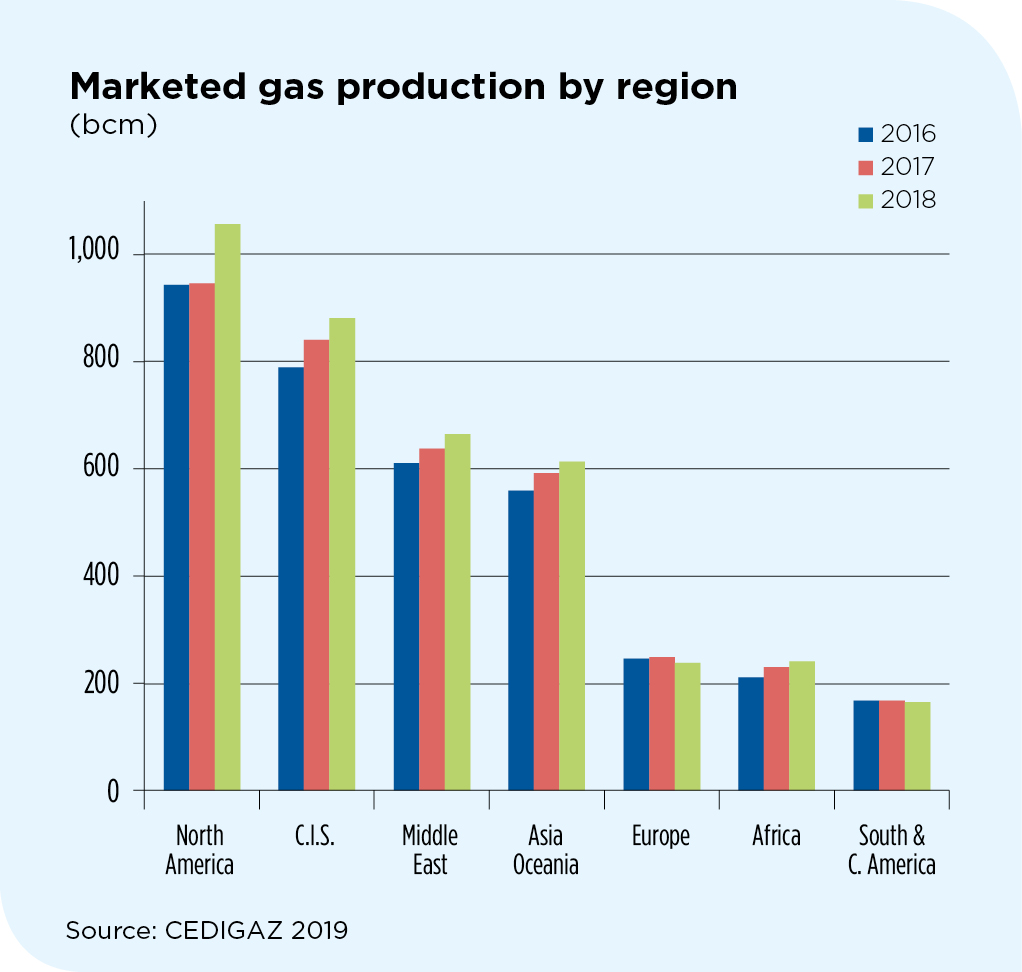
PRODUCTION SURGED 4.9% TO 3857 BCM
Global marketed natural gas production grew to an all-time high in 2018 with record net additions of 180 bcm. The US alone accounted for almost half of the total growth (+89 bcm) thanks to a remarkable jump of domestic production (+ 11.5%) entirely due to shale gas. Outside the US, robust production additions were posted in Russia, Iran, Australia, China and Egypt while the largest declines were recorded in the Netherlands (Groningen cap) and Venezuela.
Europe was the only region that saw a substantial reduction in output with declines in every main producing country.
INTERNATIONAL GAS FLOWS EXPANDED BY 3.7%, PROPPED UP BY LNG AND CHINA
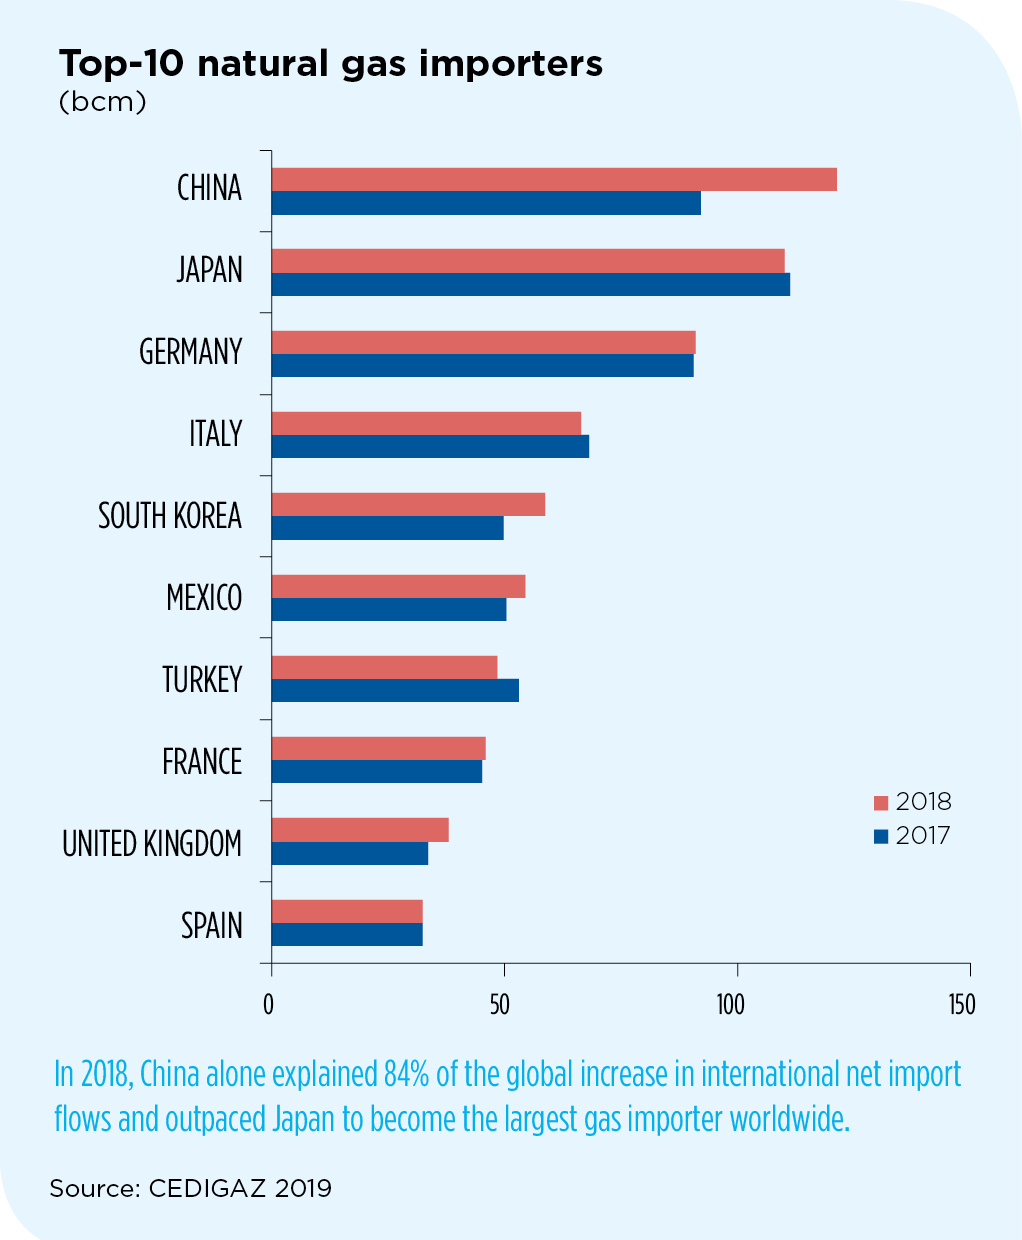
International gas trade (net flows) grew strongly to 973 bcm thanks to the LNG trade, that pursued its strong expansion wave (up 8.7% to 415 bcm), although at a slower pace than in 2017. The growth in LNG import flows was again propelled by Asia and particularly by China (+ 21 bcm). As a result, the share of LNG increased to a third of total international gas flows. Conversely, pipeline trade growth was limited – 0.3% only – essentially because of reduced intra-European gas flows against the backdrop of declining demand.
Growth in international trade came from net interregional flows (long-distance transportation needed to accommodate European and Asian markets) which jumped 11% to almost 500 bcm. Asia was responsible for more than 70% of the global increase in inter-regional imports, while Europe accounted for the rest. The CIS (mainly Russia and Turkmenistan), and to a lesser extent, North America, explained much of the growth in net inter-regional exports.
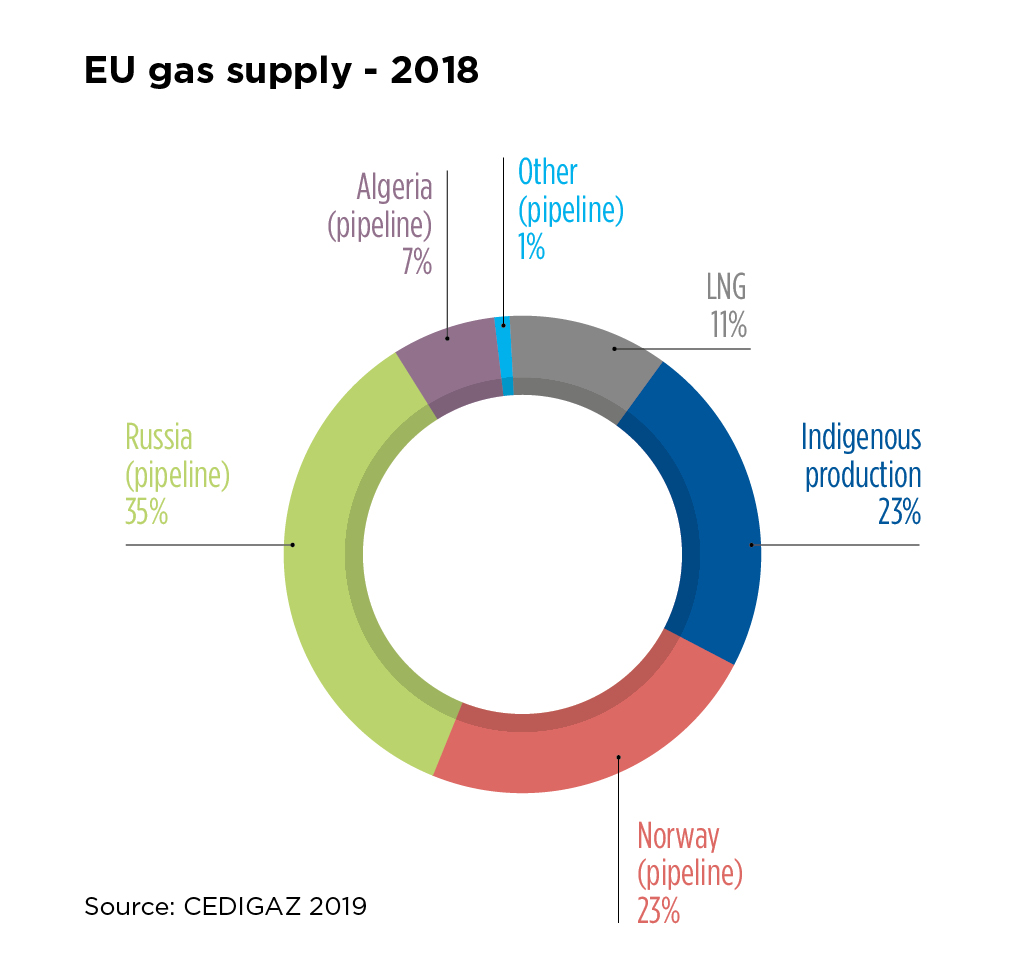
EU GAS SUPPLY DEFICIT CONTINUED TO RISE, WITH RUSSIA AS THE MAIN BENEFICIARY
The external dependence of the EU continued to climb in 2018. Despite declining gas demand, falling production caused net imports from extra-regional sources to rise by 3% to 379 bcm, accounting for 77% of EU gas supply. The UK became the leading gas producer in EU, overtaking the Netherlands, where accelerated production decline at the Groningen field turned the country from an exporter into a net gas importer. With Yamal LNG, Russia increased its market share to 36% of EU’s supply, far ahead of Norway (23%), other LNG (10%) and North African piped gas (8%).
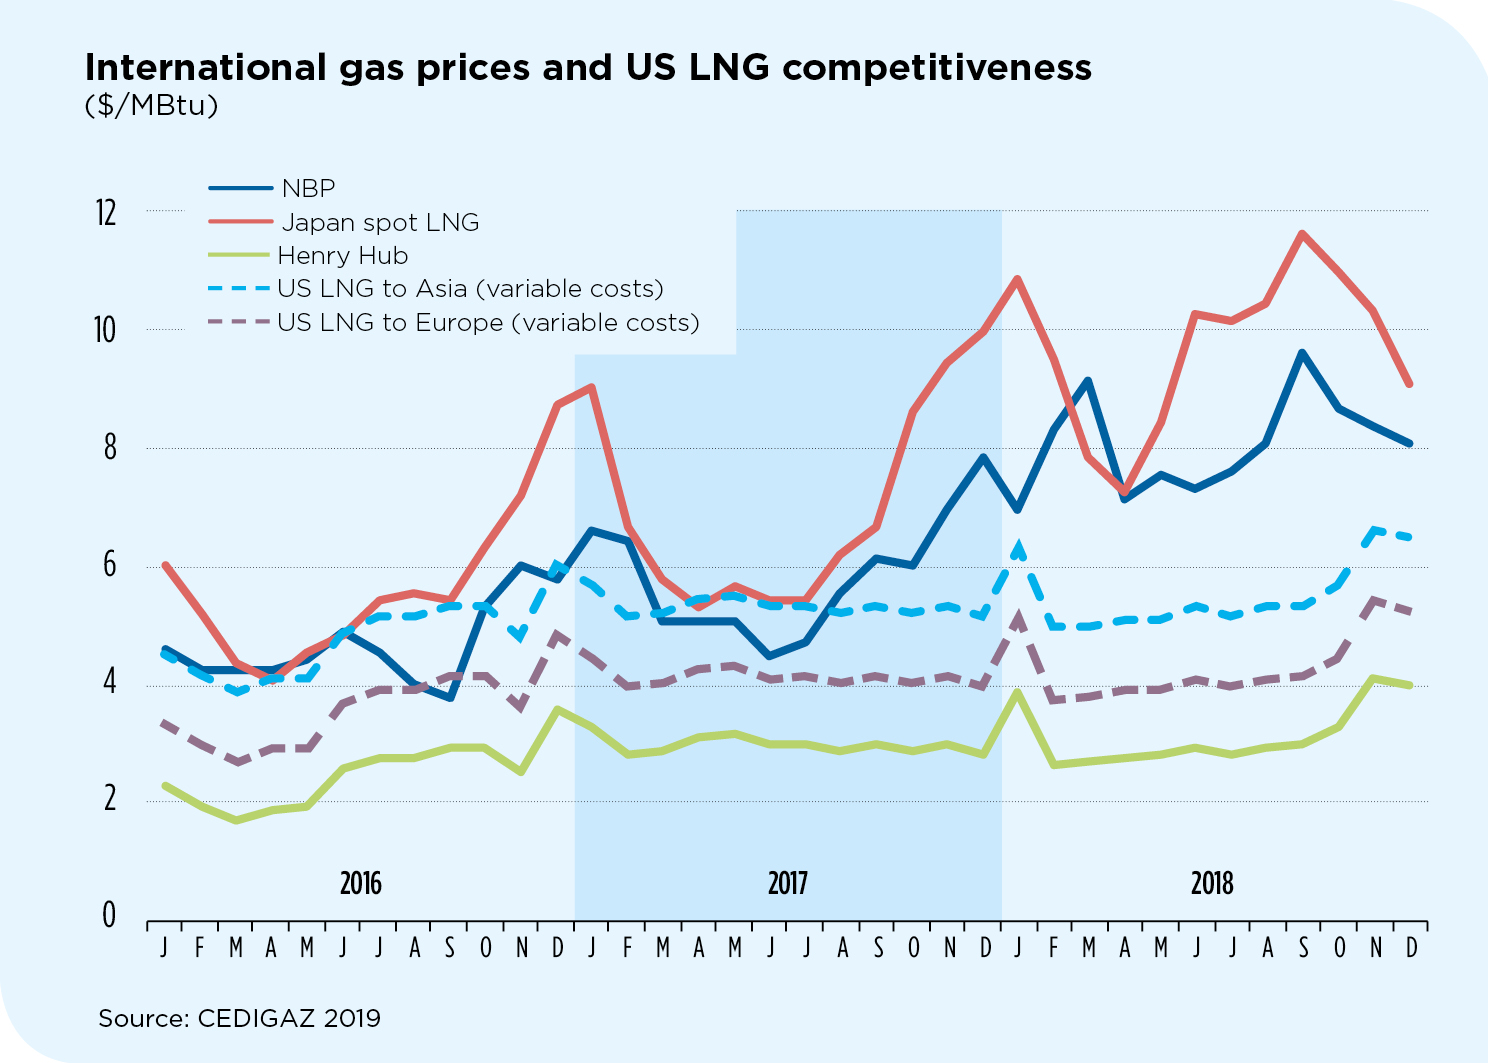
NATURAL GAS PRICES REBOUNDED IN EUROPE AND ASIA
Natural gas prices rebounded in key markets in 2018. The increase in gas prices occurred in a general context of rising prices for all fossil fuels amid fast-growing energy demand. Higher coal, oil and – in Europe – CO2 prices, as well as a relatively tight LNG market led to a general increase in gas prices. The average NBP price settled at $8.1/MBtu, 39% higher than in 2017, while Asian spot prices rose in the same proportion to $9.7/MBtu. In Q4, ample LNG supplies combined with warm weather caused gas prices to plummet. US spot prices increased from $3/MBtu in 2017 to $3.2/MBtu. After being flat at for most of the year, they rebounded during the last quarter due to low storage levels.
Armelle Lecarpentier
Chief Economist – CEDIGAZ