In the context of the COVID-19-driven economic crisis and an abnormally warm climate, global gas consumption fell 1.8% in 2020, the third decline ever recorded in the history of the global natural gas industry. In the face of extreme volatility, driven by the evolving influence of the pandemic on energy demand throughout the year, as well as weather events and technical outages, natural gas demand, especially LNG demand, was resilient, contrary to other fossil fuels.
Global marketed gas supply fell 2.9% in 2020
Global marketed gas production fell strongly by 2.9% to 3890 bcm in 2020, representing an annual loss of 115 bcm. Production of natural gas declined in every main producing region with the exception of the Middle East. The largest decrease was recorded in the Commonwealth of Independent States (CIS), which accounted for 36% of the annual drop.
At the national level, the two largest producing countries, Russia and the US, accounted for respectively 36% and 13% of the global annual decrease. In the US, natural gas production was affected by a strong decline in drilling activity related to low natural gas and oil prices in 2020. Other significant production losses were posted in the Netherlands, Egypt, Southeast Asia and South America.
Substantial production growths were observed in very few countries such as China (+ 16 bcm), and, to a lesser extent, Iran and Israel.
Figure 1: Marketed gas production by region (bcm)
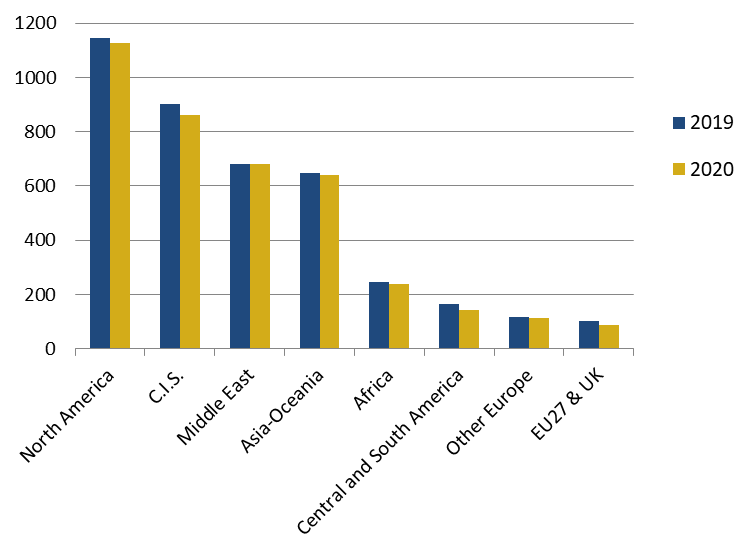
Source: Cedigaz
Global gas consumption fell 1.8% in 2020
In the context of the pandemic and economic crisis, demand for gas worldwide fell 1.8% to 3885 bcm in 2020, marking a rupture after a ten-year rapid expansion. This annual decrease represents the largest drop ever recorded in volume terms (- 72 bcm).
Thanks to its competitiveness and environmental qualities, natural gas demand was much less affected than the other fossil fuels, oil and coal, which experienced respective declines of 9% and 4%, according to the IEA.
The growing role of gas in the global energy mix was especially driven by coal-to-gas switching in power generation in the United States and Europe. Coal-fired generation also declined in contrast to the growth of gas-fired power generation in India and China.
As regards total gas demand, regional mature markets, the CIS, North America and Europe posted the most significant declines, affected by the combined effects of a mild winter in the first quarter and the first wave of the COVID-19 pandemic in the second quarter. Reversely, China continued to stand as the fastest-growing demand centre in 2020 (+ 7.6%).
Figure 2: Natural gas consumption by region (bcm)
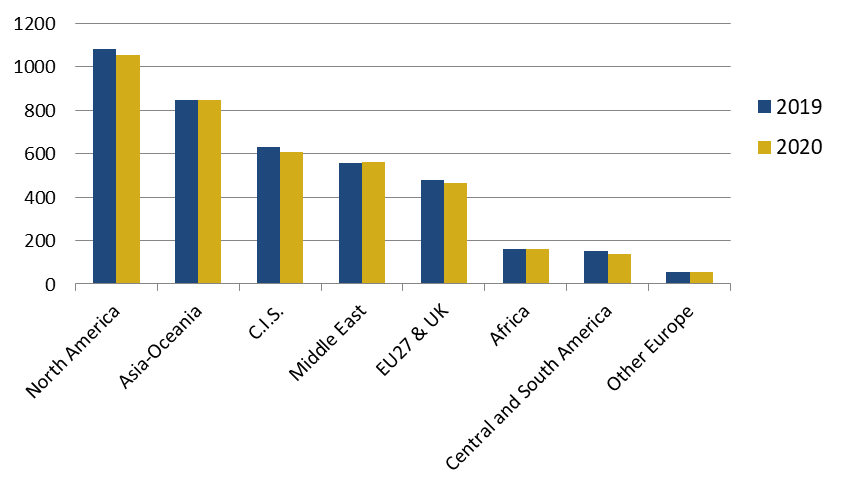
Source: Cedigaz
International gas flows fell by 2%
International gas trade (net flows) declined 2.2% to 971 bcm. This decline can be only attributed to the strong contraction of pipeline trade (- 4%), which was mainly explained by the collapse of Russian pipeline gas exports to Europe (- 12%).
Figure 3: Annual variations (2020/2019) in international gas trade by region (bcm)
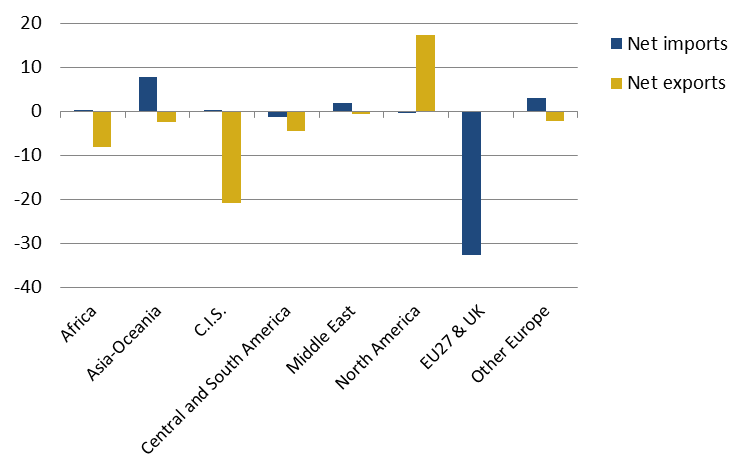
Source: Cedigaz
Reversely, LNG supply was resilient and continued to gain ground over pipeline gas, although its global growth in 2020, estimated at 0.4%, was marginal as compared with the past five-year strong expansion of 8%/year. The resilience of the LNG industry reflects the key benefits of LNG: its competitiveness, abundance and flexibility. As a result, the share of LNG in total gas flows continued to expand, reaching 48% in 2020.
Growth in international LNG trade was only driven by Asia, especially China, where the bulk of the additional supply was oriented, to the detriment of Europe, which plays a major role as a balancing market thanks to its different flexible supply sources. On the LNG supply side, the United States led the growth and provided a very flexible supply (in terms of volumes and destinations), which was crucial for the gas industry to adapt to rapidly changing market conditions along the year.
European gas supply deficit continued to grow, with LNG competing Russian gas
As indigenous production declined faster than demand, European (EU27 & UK) dependence on extra-regional imports continued to grow in 2020, reaching 81%. Gazprom continued to lose market share, down 1.5 points to 32% of European gas supply, while LNG kept a 20% market share. In the first half of the year, LNG displaced Russian pipeline gas thanks to its competitiveness, but Russian gas exports recovered in the second half as oil-indexed prices in long term contracts went down.
In total, net LNG imports in Europe declined 7.5%, while Russian pipeline gas imports fell more strongly by 12%. Pipeline imports from Algeria and Norway declined marginally, while Libyan gas exports to Italy plunged 21%. As regards LNG supply, Qatar remained the leading LNG supplier but its market share slightly declined to 26%, whereas the United States bolstered its role and expanded its share of European LNG supply from 15% in 2019 to 22% in 2020, thus overtaking Russian LNG (17%) to become the second largest LNG supply source.
Figure 4: European gas supply (EU & UK) Bcm
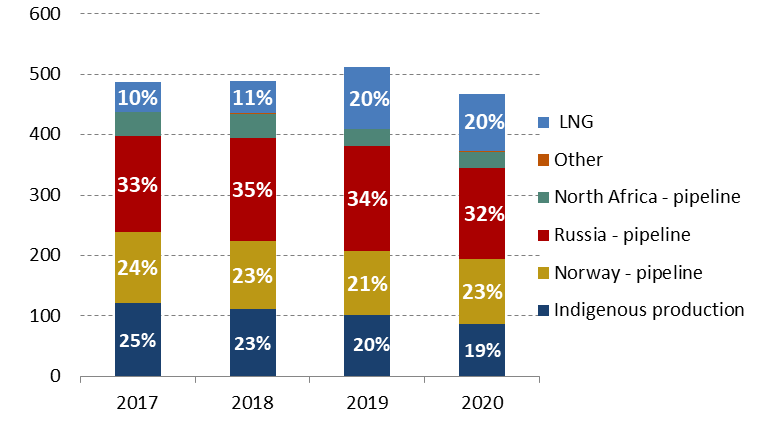
Source: Cedigaz
Natural gas prices fell to decade lows
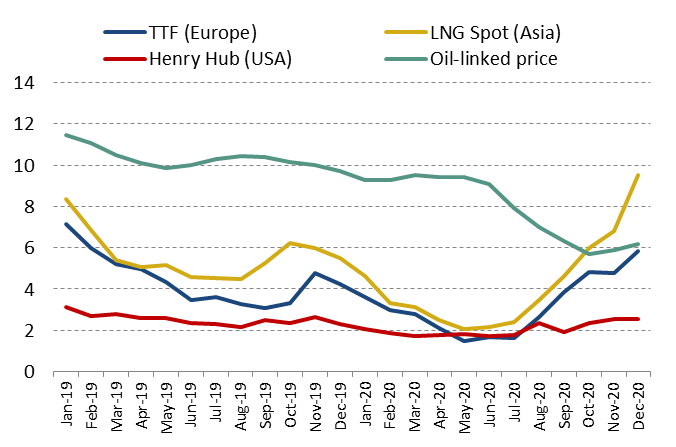
In 2020, international spot prices followed a dramatic decline: down 28% to 3.2$/MBtu for the TTF, down 25% to 4.2 $/MBtu for the Asian spot LNG price and down 20% to 2$/MBtu for the Henry Hub, the lowest US annual average prices in decades. The year 2020 showed an ever-recorded hyper-volatility in spot gas prices, which was even more important than that of oil prices. The first half of the year saw a period of convergence of international spot prices falling towards historic lows. The second half in contrast saw spot prices rebounding, with both price spreads and Asian spot prices breaking all-time highs as the year 2021 started.
The average Japan LNG price declined 22% to 7.9$/MBtu. Oil-indexed prices in long term contracts retreated In the third quarter, reflecting the impact of the collapse of the oil price during March and April with at least a three-month lag. Thus, they moved down in the opposite direction to spot prices. For the first time since 2018, oil-indexed prices were at a discount to spot prices in Asia in the last quarter.
Figure 5: Evolution of monthly international gas prices ($/MBtu)
Source: Cedigaz
For more information: contact@cedigaz.org
Cedigaz is an international association with members all over the world, created in 1961 by a group of international gas companies and the IFP Energies nouvelles (IFPEN). Dedicated to natural gas information, CEDIGAZ collects and analyses worldwide economic information on natural gas, LNG and unconventional gas in an exhaustive and critical way.
Armelle Lecarpentier, Chief Economist