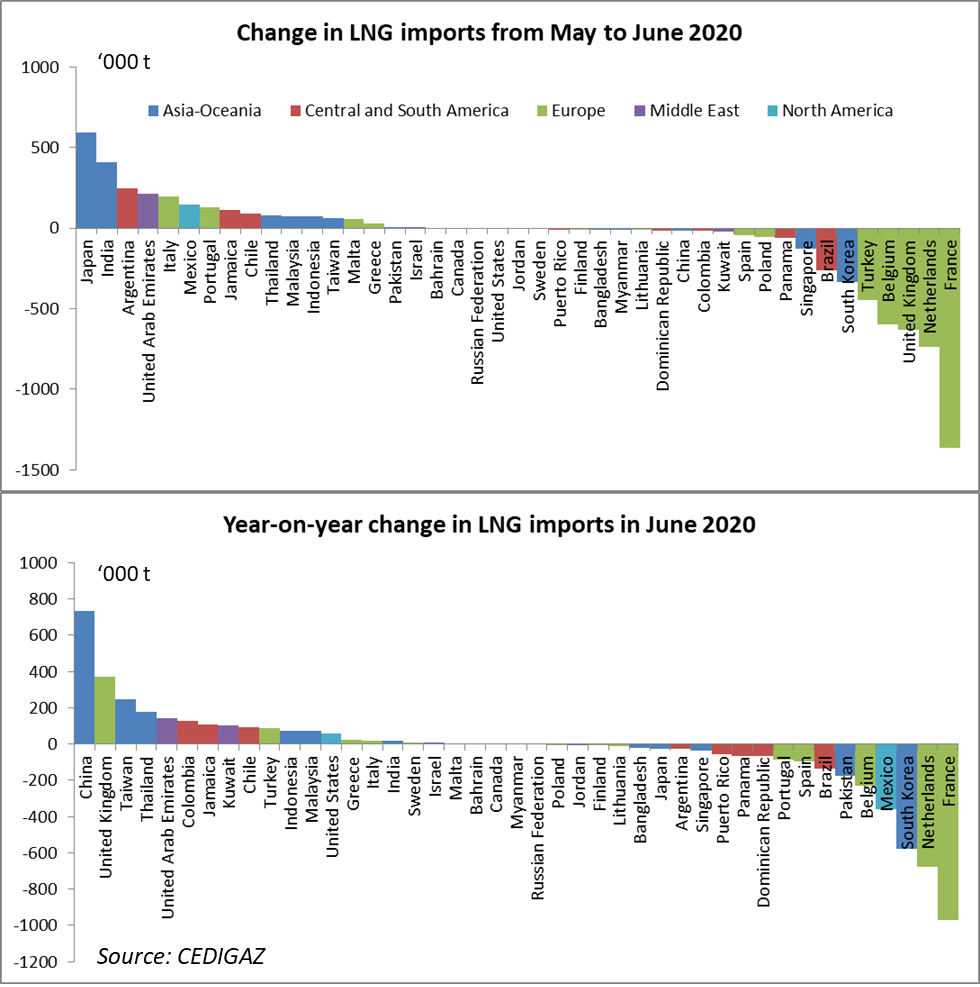
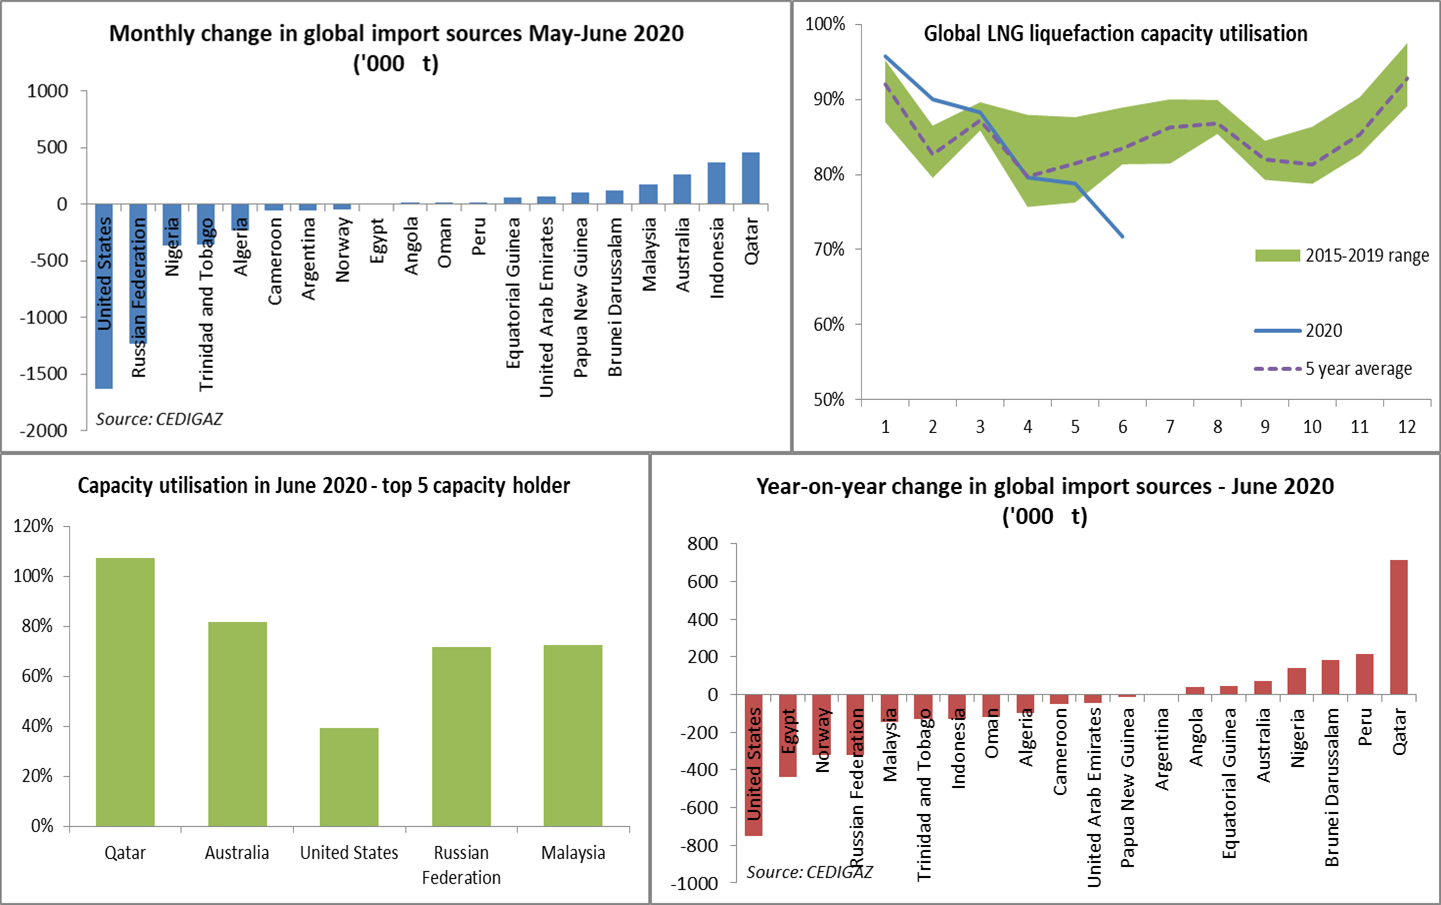
Global LNG import[1] decline accelerated in June. Preliminary data[2] point to an 8% drop (-2.3 Mt) compared to May and a 4.2% decline (-1.2 Mt) year-on-year. Global net imports stood at an estimated 26.3 Mt, which is equivalent to only 72% of global liquefaction capacity, a level significantly below the 5 year capacity utilization range in June for the 2015-2019 period (81-89%). This signals a growing oversupply in the first semester as capacity utilization had remained within the 5 year range until May and shows that the LNG market flexibility needed to absorb the surplus is being stretched to its limits.
The strong decline in June is due to Europe where imports nosedived in several major importing countries : France (- 1.4 Mt), Netherlands (-0.7 Mt), UK (-0.6 Mt), Belgium (-0.6 Mt) and Turkey (-0.5 Mt). Overall European imports (including Turkey) were down 40% in June compared to May (-3.5 Mt). All other regions registered modest growths. In particular imports grew by 0.8 Mt in Asia essentially thanks to Japan (+0.6 Mt) and India (+0.4 Mt) while they declined in South Korea (-0.3 Mt) and remained almost stable in China. The year-on-year picture is less dramatic with imports down by 1.5 Mt (-23%) in Europe, essentially due to France and the Netherlands and up 0.5 Mt in Asia essentially because of China (+0.7 Mt) while South Korean imports declined by 0.5 Mt.
Regarding the source of imports, the US and Russia bear the brunt of the volume adjustment. Total Imports from the United States were 1.6 Mt lower in June than in May (-40%), while imports from Russia were down 1.2 Mt due to planned maintenance at Yamal. Conversely, imports from Australia, Qatar grew respectively by 5 and7%. The year-on-year evolution show a similar pattern with a strong decline in US sourced imports (-0.7 Mt) – in spite of a 31 Mt increase in production capacity – paralleled by an increase in imports from Qatar of similar magnitude and a smaller increase in Australia.
Nominal capacity utilization in the United States was just 39% in June against an average 112% in Q1! In contrast, capacity utilization was 72% in Russia, 82% in Australia and 107% in Qatar, a remarkable performance for this latter, which can benefit from the lowest LNG production costs in the world.
Geoffroy Hureau – CEDIGAZ
[1] Imports net of re-exports in this text.
[2] Preliminary data from customs, European terminals and ship movements.