This memo aims to resume tracking of drilling activity at U.S. shale oil basins to assess how production has been impacted by the unprecedented drop in E&P activity due to Covid-19 and the fall of the barrel price in March. Three scenarios based on drilling activity and well productivity are analyzed for the purpose of estimating 2021 production at the 7 main producing basins, including the Permian Basin. The production figures from our scenarios, which includes only production from shale are compared to EIA’s scenarios which gives global production figures without distinguishing between shale production and conventional production.
This memo does not account for any new effects of Covid-19, e.g. the occurrence of a second wave during the winter of 2020-21 that would further reduce demand for oil and gas, cause prices to fall again and impact drilling activity in the United States.
1. The shale-oil rig count in the U.S.
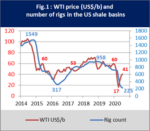
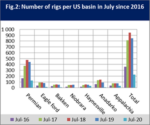
In July 2020, 225 new drill rigs were reported for that month, compared to 847 one year earlier. Activity retreated by 85% due to the drop in barrel price and Covid-19. The monthly average for the barrel price had plummeted from USD 60 in December 2019 to USD 17 in April 2020, then climbed back to USD 41 in July 2020. All basins were affected by this downtrend (Fig.2). Haynesville and Appalachia put up the strongest resistance, reporting declines in activity of 38% and 56% respectively.
The drill rig count hit a record 1549 in October 2014 (Fig.1) prior to the drop in barrel price in 2015. In May 2016, the count sank to a low of 317 active rigs. Since July 2020, the number has fallen farther still. The Permian Basin is seeing the most drilling activity (125 rigs) and accounts for 56% of all rigs active at U.S. shale oil basins.
Fig.1 illustrates the correlation between the price per barrel of WTI crude and drilling activity (rig count). When the barrel price goes down, drilling activity falls within in a short lapse of time. On the other hand, when the barrel price goes up, it takes longer for drilling activity to rise again.
 |
 |
 |
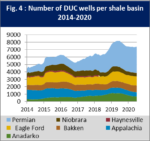
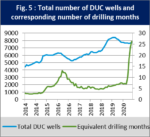
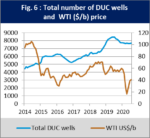
At times when the barrel price is low – as it has been since March 2020 – operators cut spending on drilling and rely on their inventory of already drilled wells waiting to be “completed”, i.e. transformed into producing wells. Figure 5 illustrates the inventory of DUC wells and what it represents in terms of the number of months equivalent of drilling. Like in 2016, the slowdown in the number of active rigs has generated a peak, reaching 26 months equivalent of drilling in July 2020. With an average productivity of 800 barrels per day and per rig at the basins, the inventory of DUC wells represents additional potential output of 11%.In July 2019, there were 8,400 drilled but uncompleted (DUC) wells. That number subsequently dropped and then stabilized in 2020 at around 7,700 (cf. Figs. 4 and 6). The Permian Basin alone accounts for 46% of DUC wells.
 |
 |
 |
2. Shale oil production
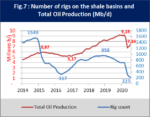
In July 2020, shale oil output was estimated at 7.34 mb/d, i.e. down by 1.3 mb/d in one year (-15%) and by 1.8 mb/d compared to the November 2019 high. Since June, it has rallied slightly (+4%), registering an increase of 0.3 mb/d. The Permian Basin still accounts for the largest share of production (4 mb/d).
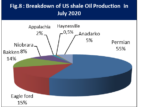
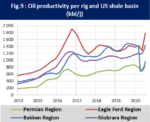
In July 2020, shale oil output was estimated at 7.34 mb/d, i.e. the same level as two years ago (Fig.7). It has fallen by 15% in twelve months and by 20% compared to the record high of 9.17 mb/d reached in November 2019. With its production of 4 mb/d, the Permian Basin represents (Fig. 8) more than half (55%) of the output of U.S. shale-oil basins, followed by Eagle Ford (15%) and Bakken (14%). The Permian Basin reported the smallest drop in production in one year (-6.5%), even showing growth (+23%) over a two-year period, whereas output at Eagle Ford and Bakken fell by 20%.
Since 2014, well productivity has seen strong improvement overall, multiplied by a factor of three (Fig.9). This can be attributed to an increase in the number of drain holes drilled and better fracturing placement. However, average basin productivity has risen more slowly since 2017 given the absence of new innovations.
Since 2020, well productivity has been subject to greater variability. Considering all basins taken together, it is only rising at a rate of 15%, probably due to a more rigorous selection of “sweet spots”, hence better well placement.
 |
 |
 |
3. The outlook for shale oil production
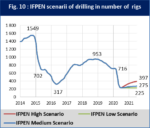
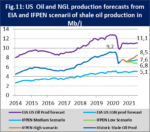
According to the IFPEN’s “median” scenario (Fig. 10), U.S. shale oil production (Fig. 11) will fall to 7.2 mb/d by year-end 2020 further to the decline in drilling activity. It will then rise over the next twelve months to 7.6 mb/d in July 2021. In this scenario, drilling activity will rebound slightly (+10%) by year-end and maintain the same pace over the next twelve months to reach 275 active rigs.
In the “low” scenario, drilling activity will remain stable at 225 active rigs, i.e. the low point reached in July 2020. Here, shale-oil production will continue to trend downward to 7.1 mb/d by year-end 2020 (-5%) and 6.8 mb/d (-10%) in one year.
According to the “high” scenario, drilling activity will rally strongly (+40%) by year-end, practically doubling in one year to reach 400 active rigs by July 2021. At year-end 2020, shale oil production will stabilize at its July 2020 level (7.34 mb/d), then trend upward to reach 8.5 mb/d in twelve months.
In all three scenarios, well productivity for 2020 and 2021 is considered to be constant over time. These scenarios do not account for recourse to DUC wells (already drilled but uncompleted), the effect of which is to lower the number of active rigs.
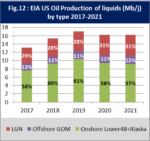
Regarding the average annual value for the baseline (median) scenario (Fig.12), production is expected to drop from 8.6 mb/d in 2019 to 7.8 mb/d in 2020, i.e. a decrease of 0.8 mb/d (-9%).
By way of comparison, the EIA is projecting that, for 2020, annual production on land[1] (Alaska and the Lower 48 states) will be 9.4 mb/d, down by 1 mb/d (-9 %) in one year. Total annual production, including NGL and Gulf of Mexico (GOM) output, is expected to be 16.2 mb/d, down by 0.8 mb/d (-5%) in one year. In 2020, shale oil has accounted for 58% of U.S. liquid hydrocarbon output, oil from the Gulf of Mexico 12% and natural gas liquids (NGL) 31%. For 2021, the EIA expects that the total U.S. NGL output will remain virtually stable, registering a decrease of 0.25 mb/d that will be offset to a large extent by offshore production in the Gulf of Mexico.
 |
 |
 |
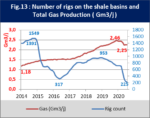
4. Shale gas production
In July 2020, output was estimated at 2.25 bcm/d, down by 2.4% in one year, but up by 13% over a two-year period. The decrease in output was smaller for shale gas (-2.4%) than shale oil (-15%). The Appalachia Basin accounts for the largest share of production (41%).
In April 2020, the price per barrel fell to USD 17, causing a dip (-2.4 %) in shale gas output in twelve months (Fig.13). Compared with the December 2019 high of 2.46 bcm/d, the decrease in output is more pronounced (-8.5%), due in large part to the drop in shale oil production. More than 30% of the gas produced comes from three shale oil basins (Permian, Eagle Ford and Bakken) whose shale gas output (0.67 bcm/d) represents more than 40% of their total production.
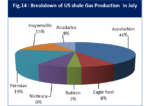
The Appalachia Basin (Fig.14) accounts for 41% of shale gas production, followed by the Permian Basin (19%) and the Haynesville Basin (15%). Over a one-year period, these three were the only basins that managed to stabilize output and report modest growth (between 1 and 3%); production was down at all of the other basins.
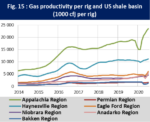
The productivity of shale gas wells (Fig. 15) has more than doubled on average since October 2014. The Permian, Bakken and Anadarko Basins posted the largest increases in productivity (300%, 240% and 240%, respectively). As in the case of shale oil, the rise in productivity per rig has been less significant since 2017. In 2020, productivity was subject to great variability yet still continued to rise (+8% in one year, for all basins taken together).
 |
 |
 |
5. The outlook for shale gas production
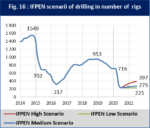
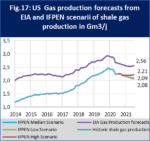
According to IFPEN’s “median” scenario, (Fig. 16), U.S. shale gas production (Fig.17) will fall to 2.17 bcm/d by year-end 2020, then to 2.09 bcm/d by July 2021. Here, output will continue to fall, but drilling activity will rebound slightly (+10 %) by the year-end and continue at the same pace to reach 275 active rigs in one year.
In the “low” scenario, drilling activity will remain stable at 225 active rigs, the low level reached in July 2020. Here, output will be very close to the one in the median scenario, reaching 2.17 bcm/d by year-end then dipping slightly to 2.06 bcm/d in one year.
In the “high” scenario, drilling activity will rally strongly (+40%) by year-end, practically doubling in one year to reach 400 active rigs. Here, gas production will stabilize at 2.19 bcm/d by year-end 2020, then trend slightly upward in 2021 to reach 2.22 bcm/d in one year.
In all three scenarios, well productivity for 2020 and 2021 is considered to be constant over time. They do not include recourse to DUC wells (already drilled but uncompleted), the effect of which would be to lower the number of active rigs.
As for the average annual value for the baseline (median) scenario, shale gas production is expected to drop from 860 bcm in 2019 to 850 bcm in 2020. In other words, it is expected to remain virtually stable (-1%) despite the production fluctuations arising in 2019 and 2020.
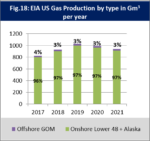
By way of a comparison, the EIA forecast for 2020 (Fig.18) projects that the annual output of gas (both conventional and unconventional) will be 990 bcm, a decrease of 4% in one year. Here, offshore production in the Gulf of Mexico will still represent about 3% of total U.S. gas output with production on land (Alaska and the Lower 48 states) accounting for 97%.
Offshore production will fall by 7% for 2020 compared to 2019 while production on land will slip by a lesser extent (-3%). For 2021, the EIA expects that total gas production will continue to decline (-5%) and that offshore production will remain stable.
 |
 |
 |
[1] The EIA provides projections of oil, NGL and gas production in the United States in its monthly Short Term Energy Outlook: https://www.eia.gov/outlooks/steo/report
By Sylvain Serbutoviez