Highlights from the latest update of Cedigaz’ Worldwide UGS Database.
No significant changes compared with 2015, except in Europe
As of end 2016, there were 672 underground gas storage (UGS) facilities[1] in operation in the world, representing a working gas capacity of 424 billion cubic meters (bcm), or 12% of 2016 world gas consumption. The number of storage facilities has decreased (680 UGS in 2015), mainly due to closure/mothballing of UGS in the United States and Europe. However, the global working capacity has slightly increased (+11 bcm) driven by expansions in the Commonwealth of Independent States (CIS), the Middle East and China. In Europe, storage capacity has continued its decline. Working gas capacity decreased by 5.8 bcm due to the closure of storage facilities in Germany, Ireland and the UK. The temporary closure of the Rough depleted field was confirmed as a permanent one in June 2017. This sharply reduces the UK storage capacity, and especially its seasonal storage capacity.
Global peak deliverability rates slightly decreased to 7,126 million cubic meters per day (mcm/d) as of end 2016, down 2.6% from 2015. The decline is linked with the closure of European UGS.
Figure 1: Major changes in working capacity and withdrawal rates (2016 vs. 2015)
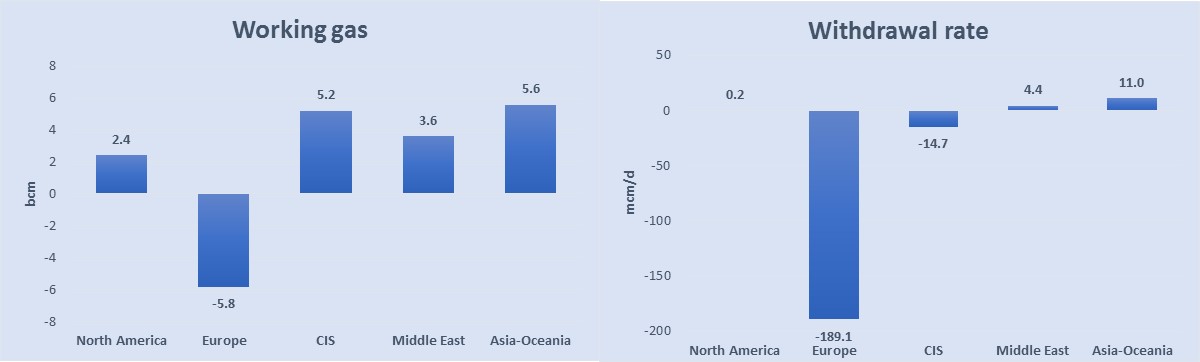 Source: CEDIGAZ
North America leads the market
Underground gas storage has been developed in five regions: North America, Europe, the CIS, Asia-Oceania, and recently the Middle East (Iran). North America concentrates more than two thirds of the sites, with 392 active storages in the US, and 62 in Canada, a combined working capacity of 160 bcm (38% of the world total), and 3,697 mcm/d of peak withdrawal rate (52% of the world total). There are 143 facilities in Europe (107.5 bcm, 1,999 mcm/d), 48 in the CIS (125.1 bcm, 1,201 mcm/d), 23 in Asia-Oceania (21.8 bcm, 168 mcm/d), and 3 in the Middle East (9.9 bcm, 61 mcm/d). There is also one small site in Argentina.
Figure 2: Global underground gas storage as of end 2016 – by region
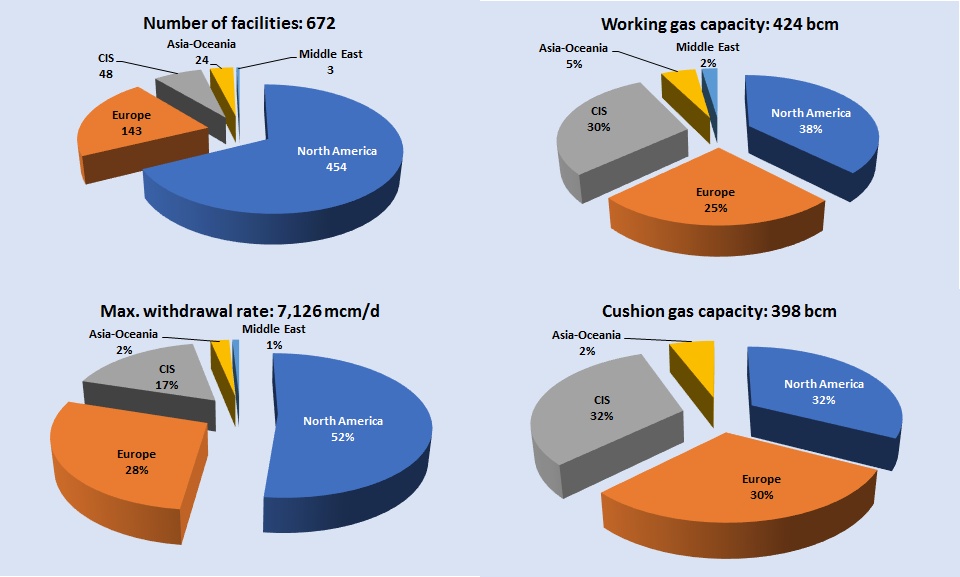 Source: CEDIGAZ
Historical evolution: the growth decelerated in 2016
Working gas capacity has increased significantly since 2010 (+74 bcm, or +21%), mainly under the impetus of Europe which added almost 19 bcm of capacity (net growth) in the past six years. However, the increase occurred before 2015 and the trend has reversed since that date. European working gas capacity (and net growth) declined in 2016. The growth over the period 2010-2016 was pronounced and stable in the other regions: CIS: +15.7 bcm, Asia-Oceania: +15.1 bcm, and North America: +14.3 bcm. One additional region, the Middle East[2], took part in this development (+9.8 bcm). The annual growth in working capacity averaged 3.4% per year between 2010 and 2015. However, the increase slowed down in 2016 at only 2.6%.
Figure 3: Evolution of global working gas capacity, 1970 -2016
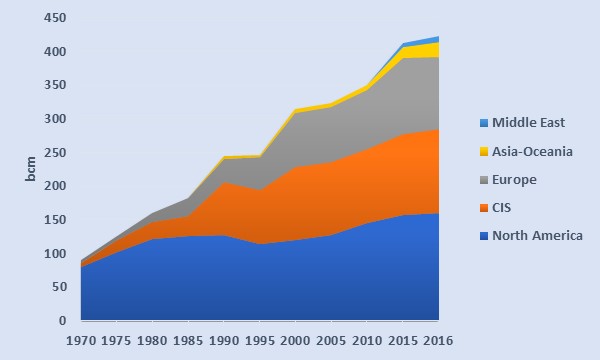 Source: CEDIGAZ
Depleted fields dominate, but UGS in salt caverns is growing faster
The breakdown of underground gas storage by type of storage shows the dominance of depleted fields, which allow storing large volumes of gas and are mainly used to balance seasonal swing in gas demand. With 498 facilities in the world, depleted fields represent 74% of the total number of sites and 80% of working gas volumes.
However, market liberalization has brought some important changes in the gas storage market. Today, storage is also used as a financial tool to optimize gas portfolios at short term. This trend can be seen in the growing importance of salt cavern storage in North America and Europe. This type of storage allows high injection and withdrawal rates, and the working gas can be cycled several times per year. As of end 2016, 97 salt caverns facilities are in operation in the world (76 in 2010), representing 14% of the world total. Although salt caverns account for only 8% of global working gas capacity, they can be rapidly cycled and they deliver up to 24% of global deliverability.
Figure 4: Global underground gas storage as of end 2016 – by type
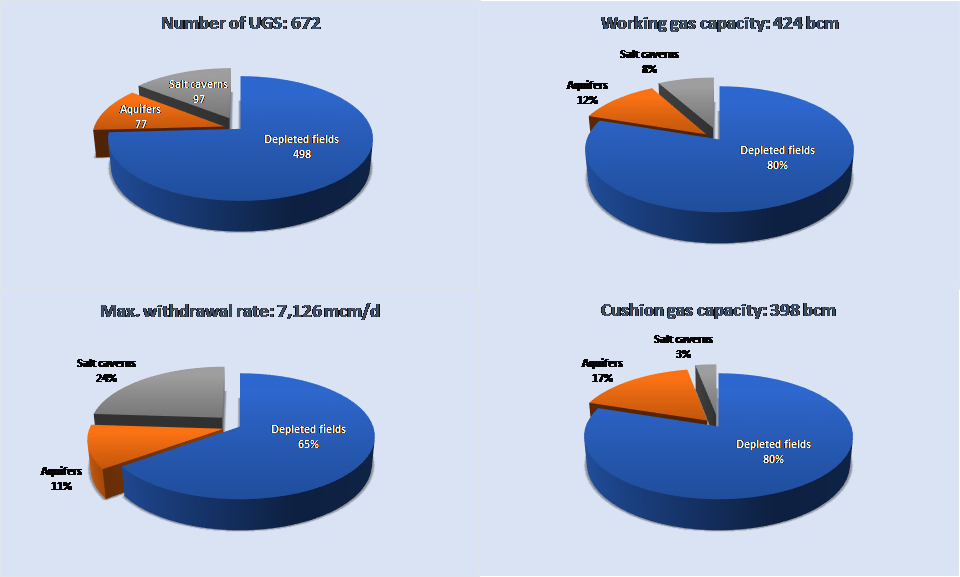 Note: Salt caverns include two rock cavern facilities and one abandoned mine.
Source: CEDIGAZ
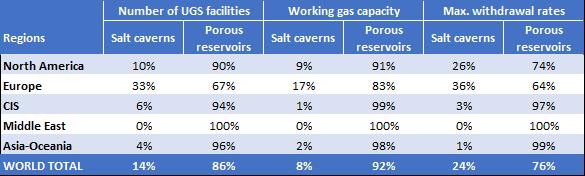
A closer look on the type of facilities in operation in the world reveals important disparities from one region to another. Even if porous reservoirs (depleted fields and aquifers) largely dominate the total number of storage facilities in all regions, their share falls to 67% in Europe, where salt caverns represent a higher proportion than in other regions. Conversely, the CIS holds only three salt cavern facilities, Asia-Oceania only one and the Middle East none.
Table 1: Distribution of UGS facilities by region
 Note: Porous reservoirs include depleted fields and aquifers.
 Note: Porous reservoirs include depleted fields and aquifers.
Source: CEDIGAZ
Top Ten league
As of end 2016, the United States is by far the most important country in terms of installed working capacity, with almost 134 bcm out of a global volume of 424 bcm. Together with Russia and Ukraine, with respectively 76 bcm and 32 bcm of working capacity, Canada and Germany (26 bcm and 24 bcm respectively), these five countries concentrate 69% of the worldwide capacities. Major changes have occurred since 2010: The Netherlands, China and Austria have entered in the Top Ten league. The Netherlands entered the league in 2015, following expansion of storage sites associated with the Groningen field and the commissioning of a large seasonal field (Bergermeer). China also entered the league in 2015 as several new storage facilities were commissioned in 2014 and 2015, following the policy adopted in 2012 favoring the development of storage. Austria is also among the Top Ten storage-holders thanks to the completion of the Haidach expansion and the commissioning of the 7Fields UGS in 2013. Italy, with 17 bcm of working capacity, remains in the sixth place, while France was outpaced by China in 2016. In terms of deliverability, the US and Russia remain the leading countries with withdrawal capacities of respectively 3,331 and 784 mcm/d. Germany ranks third with 642 mcm/d.
Figure 5: World Top Ten storage countries, as of end 2016
 Source: CEDIGAZ
[1] Some individual storage sites are grouped into storage clusters (for instance in China and Russia). If counted as individual sites, there are 687 storage sites worldwide. Some storage facilities are inactive or mothballed (20 UGS). If added, the world total is 707 UGS.
[2] The updated database has been corrected and includes a storage facility built in Abu Dhabi in the 1990s.
Related: Underground Gas Storage & Lng Storage Market In The World (2015-2035)