In a volatile and unstable economic and geopolitical context, global natural gas consumption grew at a modest rate of 0.7% to 4181 bcm in 2025, translating to around 31 bcm of additional consumption, according to Cedigaz first estimates. This represents a notable slowdown in natural gas demand growth from 2024, when it surged by 2.7%. In the first half of the year, high spot LNG prices, weak industrial activity in price-sensitive sectors and unseasonably mild weather across Northeast Asia weighed on natural gas demand. However, natural gas demand accelerated during the second half of the year amid easing market conditions due to a pronounced rebound of LNG supply. Indeed, the year 2025 marked the biggest jump in LNG supply since 2019. Thanks to the strong expansion of flexible LNG, driven by the United States, natural gas markets are increasingly intertwined with broader global security challenges. Spot LNG price signals played a crucial role in the reorientation of LNG cargoes from Asia to Europe. The European gas supply is increasingly dependent on flexible LNG supply to replace piped volumes lost from Russia and replenish storage ahead of winter. The year 2025 emphasized the key role of natural gas in the electricity sector for balancing out renewable energy sources in both emerging and advanced economies.
Global natural gas consumption rebounded in Europe but was unusually sluggish in Asia
From a regional perspective, global consumption growth in 2025 was mainly driven by North America, Europe and the Middle East. Rising heating needs in key Northern Hemisphere markets emphasized the continued importance of natural gas in ensuring the security of heat supply during winter. In the European Union, natural gas consumption rose 2.2% to 335 bcm, the largest growth since the post-pandemic recovery. Gas remains a crucial anchor for the electricity system, particularly during evening peaks and periods of subdued renewable output.
Conversely, natural gas demand growth abruptly stopped in the Asian market, contrasting with the structural rapid expansion of the previous decades. China’s gas demand slowed markedly, up only 1.1% y-o-y, under the effect of a mild weather and muted industrial activity early in the year.
Another noteworthy evolution in 2025 was the collapse in natural gas consumption in the Commonwealth of Independent States (CIS) and Ukraine. Mild winter conditions impacted electricity and gas demand, while the economic downturn against the backdrop of the war in Ukraine hampered industrial production.
Global marketed natural gas production increased by 1.1% in 2025
On the supply side, global marketed production grew 1.1% to reach 4191 bcm in 2025, adding 46 bcm to the market. This growth was led by the United States, which added 45 bcm, marking a 1 percentage point increase in its leading global production share from 26% in 2024 to 27% in 2025. Canada was also a major contributor to the expansion of global gas supply (+ 7 bcm). North America has thus remained the key pillar of the global gas supply growth. In other countries, a remarkable production growth was also observed in China (+ 15 bcm), which is expanding its domestic production capacities. In contrast to these trends, production in the CIS plunged in 2025, driven by Russia (- 21 bcm).
FIGURE 1: variation in regional production and consumption in 2025 vs. 2024 (bcm)
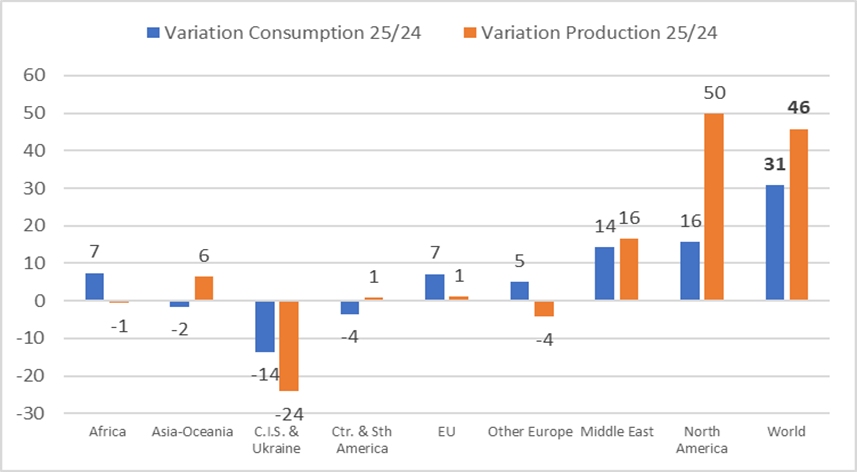
Source: CEDIGAZ First Estimates 2026
Figure 2: Evolution of natural gas consumption by geographical zone since 2015 (bcm)
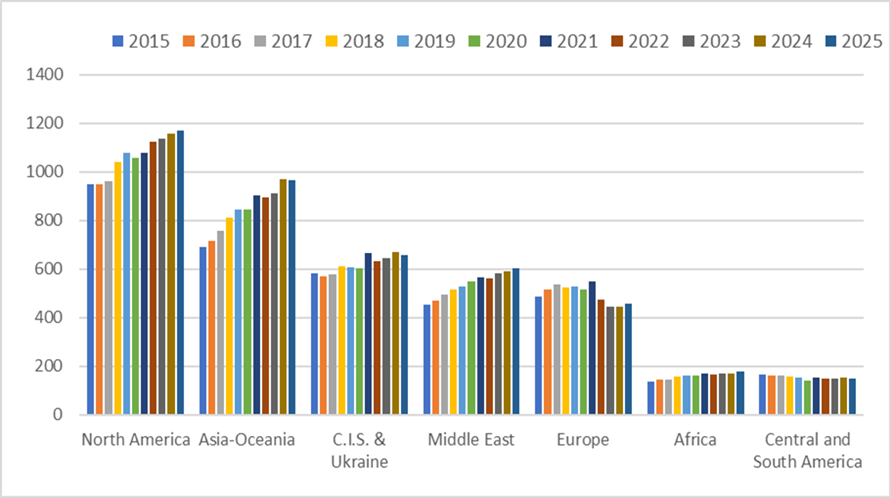
Source: CEDIGAZ First Estimates 2026
International gas trade increased 2.2% in 2025, driven by a surge in LNG supply
International gas trade (net LNG and pipeline gas flows) recorded an expansion of 2.2% to reach 1038 bcm in 2025. This follows a 3.1% growth in 2024. This growth was not sufficient to catch up with the 2021 level. In absolute terms, the expansion of international gas trade represented an annual gain of 22 bcm in 2025, compared to 31 bcm in 2024. This expansion was solely driven by LNG trade, which accelerated by 5.4% to reach 563 bcm in 2025, adding almost 30 bcm on the global market. This largely compensated the decline of international pipeline trade, down 1.5% or 7 bcm to 475 bcm. This decline can be attributed to the significant drop in EU pipe gas imports from Russia (- 16 bcm), and, to a lesser extent, Norway. As a consequence of these developments, the market share of LNG in international gas trade grew from 53% to 54%.
Continuing the trend of the last five years, the United States was the driving force behind the global expansion of LNG supply, providing an additional volume of 29 bcm, which mainly came from the ramp up of new projects across the Gulf Coast.
Europe contributed for the bulk of global incremental LNG demand. LNG imports in the EU grew dramatically by 30% (+ 32 bcm) to reach a new record of 140 bcm in 2025 in a context of tightening market fundamentals characterized by weather-related growth in demand, stronger gas storage injections needs and lower pipeline imports from Russia (halt of Ukraine transit) and Norway. In Asia, LNG demand declined by 4.5% ( – 17 bcm) to 354 bcm in 2025, under the effect of a strong decline in China (- 16 bcm), where LNG was squeezed between a slowly growing domestic gas demand, increased pipeline gas imports from Russia and fast-growing domestic production. At the national level, Egypt recorded the largest growth in LNG imports worldwide in volume terms (+ 9 bcm) in order to resorb a growing national energy deficit.
FIGURE 3: evolution of international gas trade since 2000
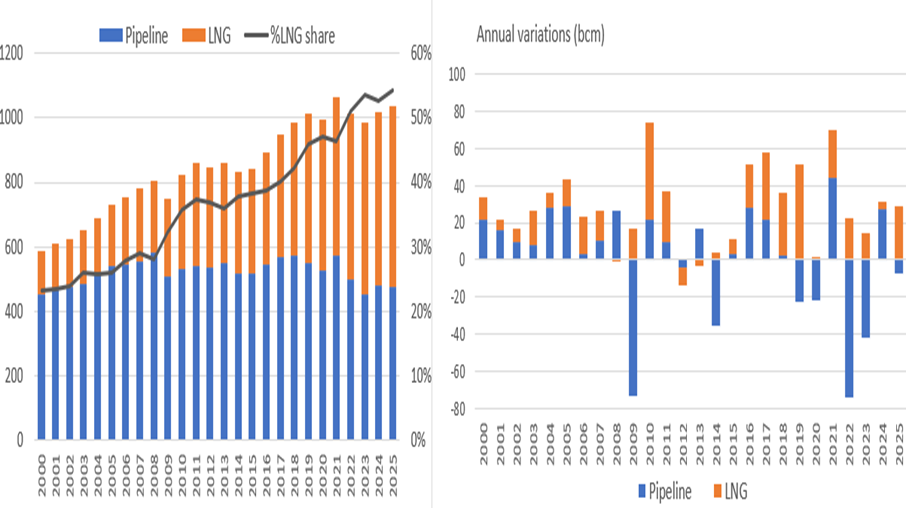
Source: CEDIGAZ First Estimates 2026
International spot gas and LNG prices increased in all key regional markets
Amid tightening natural gas market fundamentals and the reduction of Russian gas imports in Europe, the TTF price increased by 9.2% to 11.9 $/MBtu in 2025. By comparison, the TTF reached 10.9 $/MBtu in 2024, when it had fell strongly from the crisis-driven all-time high levels of 2022 and 2023.
The strong growth in LNG supply combined with a mild winter in the second half exerted a bearish impact on European spot prices later in the year.
Spot LNG prices in Asia traded closely in line with TTF for much of 2025, reflecting the growing interconnection of international LNG markets.
While the TTF and JKM prices remained well below the extreme peaks observed during the 2022 energy crisis, they stayed above pre-2021 levels. Geopolitical risks and supply uncertainties continue to have a strong upward impact on spot prices.
FIGURE4: EVOLUTION OF ANNUAL INTERNATIONAL GAS PRICES. $/MBTU
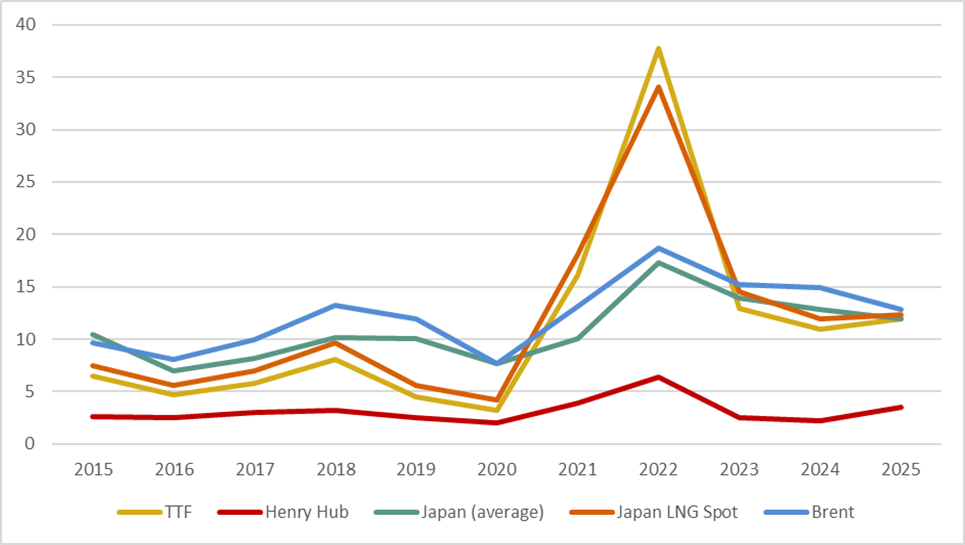
Source: CEDIGAZ. US EIA. Argus. Reuters
For more information: contact@cedigaz.org
Cedigaz is an international association with members all over the world, created in 1961 by a group of international gas companies and the IFP Energies nouvelles (IFPEN). Dedicated to gas information, CEDIGAZ collects and analyses worldwide economic information on natural gas, renewable gases (biogas & hydrogen), LNG and unconventional gas in an exhaustive and critical way.