In 2024, global natural gas demand was estimated to have recorded a strong 2.9% growth, to stand at a new record of 4166 bcm, representing an annual incremental volume of 118 bcm. By way of comparison, growth over the pre-crisis period 2010-2019 stood at 2.4 %/year. This rebound was partly due to structural growth factors, which are expected to persist in the long term, including energy policies in favour of the expansion of gas, the booming Asian gas market, the growing role of gas as a dispatchable electricity source supporting intermittent renewables, increased use of LNG for transportation and more sudden and extreme climatic events which reinforced the crucial role of gas-fired power generation for peak load. On the supply side, global marketed natural gas production increased more moderately by 1.7% to 4159 bcm, driven predominantly by Russia, China and Norway. Despite tight LNG supplies, demand continued to grow robustly as major consumer markets tapped into their abundant stocks during periods of market tensions to ensure gas supply security and flexibility. In this context, European and Asian spot prices softened from the previous year but remained elevated. High price volatility reflected unforeseen events on both the supply and demand sides, including geopolitical tensions and extreme weather events.
Global natural gas consumption jumped by 2.9% in 2024
Natural gas demand grew across every region but three in particular drove incremental demand: Asia in the lead, with a substantial absolute growth of 50 bcm, followed by Eurasia and North America. More specifically, 2024 witnessed strong growth in China (+ 32 bcm), followed by Russia (+ 23 bcm) and the United States (+ 14 bcm), where gas continued to strengthen its crucial role in power generation at the expense of coal. These top three countries accounted for almost 60% of the global incremental gas demand in 2024. Other key contributors included India and Canada. Consumption in the Middle East also experienced notable growth. By contrast, demand growth was much more modest in Europe, South & Central America and Africa. In the EU, natural gas consumption recovered slightly by 1% y-o-y to 329 bcm (+ 3.2 bcm) and remained significantly below pre-crisis levels.
FIGURE 1: VARIATION IN REGIONAL PRODUCTION AND CONSUMPTION IN 2024 VS. 2023 (BCM)
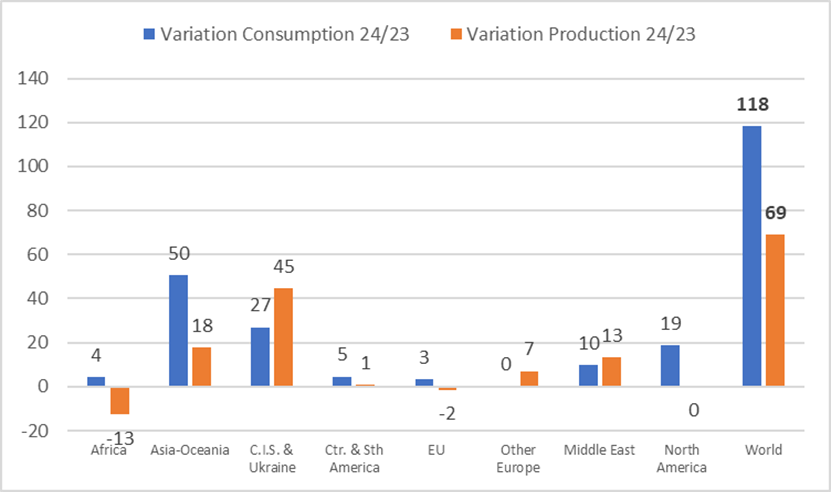
Source: CEDIGAZ First Estimates 2025
FIGURE 2: EVOLUTION OF NATURAL GAS CONSUMPTION BY GEOGRAPHIC ZONE SINCE 2015 (BCM)
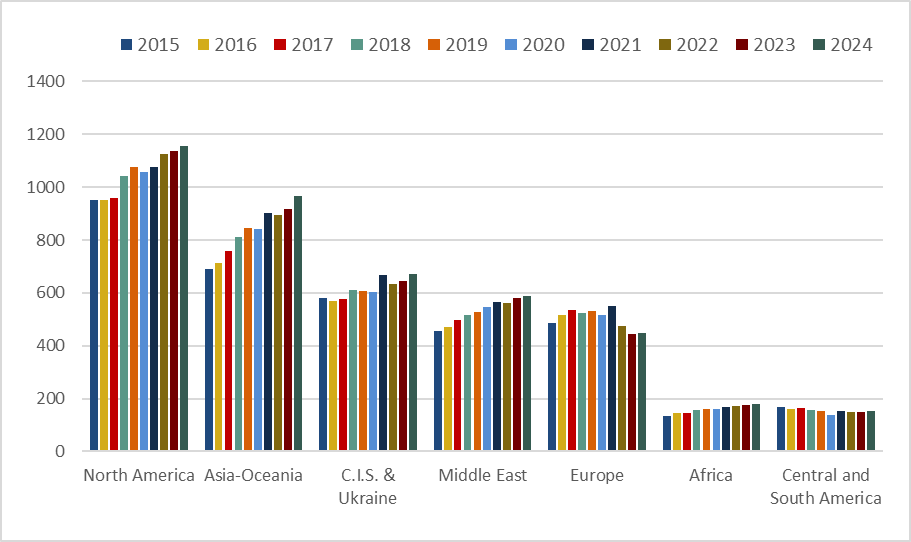
Source: CEDIGAZ
Global marketed natural gas production increased by 1.7% in 2024
On the supply side, global natural gas production increased more moderately by 1.7%, representing an annual gain of 69 bcm. The growth was concentrated in Russia (+ 46 bcm). Significant growths were also recorded in China (+ 16 bcm) and Norway (+ 9 bcm). On the other hand, some countries were affected by severe feedgas shortages and depressed upstream activity, especially in North Africa (Egypt). In the United States, the world’s largest producer, production stabilized after a prolonged period of robust growth as historically low gas prices curbed drilling activity.
From a regional perspective, North America kept its leading position in global gas supply, but Eurasia improved its market share at the expense of other producing regions.
International natural gas trade rebounded in 2024, under the impetus of pipeline natural gas flows
After two years of strong decline, international gas trade (net flows) returned to growth, up 3.1% to 1016 bcm in 2024, close to its 2022 level but still below the 2021 peak. International pipeline trade rebounded 5.9% to 482 bcm, as a result of higher pipeline gas exports from the leading exporter countries. On the other hand, international LNG trade posted a modest growth of 0.8% to 534 bcm.
As for the major natural gas importing regions, year 2024 showed regional contrasting trends. Strong demand growth in Asia resulted in a sharp 7.4% increase in net imports (+ 31 bcm) to 451 bcm, both through LNG tankers and by gas pipelines (Russia to China). This growth contrasted with a strong drop in European (EU & UK) net gas imports, down 3.8% to 308 bcm, with higher pipeline flows from Russia (+17 %) and Norway (+ 7.9%) only partially mitigating the drop in LNG supply (- 19.5%). Thus, the LNG share in European gas supply fell significantly from 37% to 31.5%, while Norway’s pipeline gas saw its share progress from 27% to 31%. Despite the geopolitical context, Russian LNG imports rose to 23 bcm, solidifying Russia as the second largest LNG supplier to Europe behind the United States.
A noteworthy evolution in international trade in 2024 was the sharp rebound of Eurasian net gas exports, up 10.3 % to 224 bcm, driven by Russian pipeline flows to Europe and China.
LNG supply growth in 2024 was primarily supported by Russia and the United States, reflecting the consolidation of the US leadership and the continued high reliance of many importing markets on Russian LNG supply despite international sanctions.
FIGURE 3: EVOLUTION OF INTERNATIONAL GAS TRADE SINCE 2000
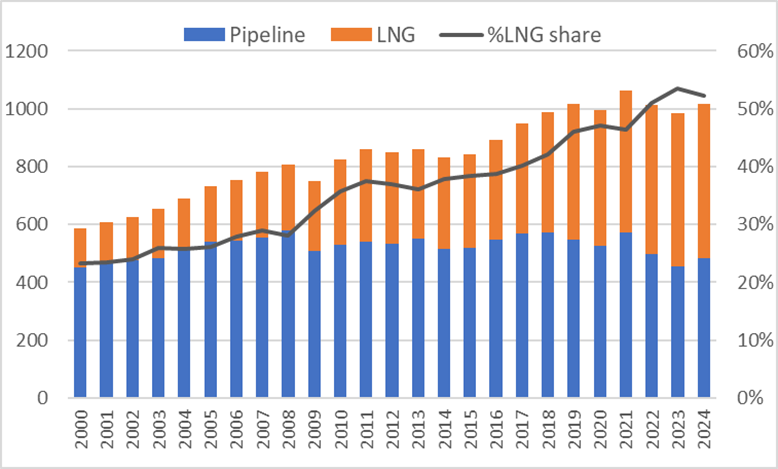
Source: CEDIGAZ First Estimates 2025
Gas and LNG prices softened on key regional markets in 2024
International gas prices have continued to decline from their historic highs in 2022 across all key markets amid easing market fundamentals and high stocks, although they remained elevated compared to pre-energy crisis levels.
European gas price TTF fell 15.5% to 10.9 $/MBtu in 2024, its lowest level since the Covid crisis. Spot LNG prices in Asia closely tracked the market dynamics impacting the European market. The JKM fell almost 18% to 11.9 $/MBtu.
LNG supply growth was very weak and well below the historical average in 2024, so that the market balance tightened throughout the year, as shown by the rocketing of Asian and European spot prices in the last months of 2024.
For more information: contact@cedigaz.org