CEDIGAZ’ Natural Gas in the World 2016 report confirms the provisional estimates published early May, showing a moderate natural gas demand growth in 2015 for the third year in a row. Global gas consumption grew by 1.5%, still below the ten-year growth rate of +2.2% despite low gas prices. The global marketed natural gas production growth was again led by the United States (shale gas).
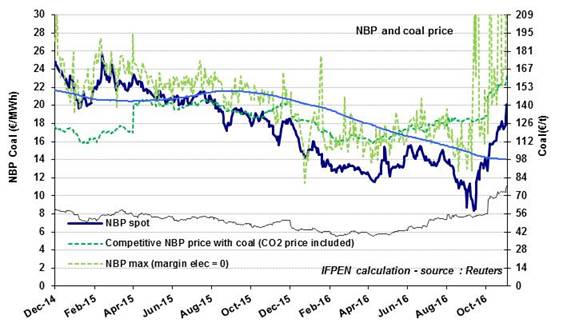
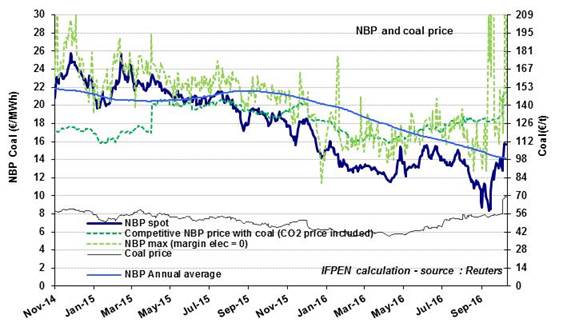
Like in 2014, the natural gas expansion was constrained by some demand side factors which have offset the impact of low gas prices: intense competition with cheaper coal (and oil in China) in both industrialized and emerging markets, the development of nuclear and renewables, as well as increased energy efficiency, weak power generation growth and the sluggish economic context.