Cedigaz LNG Blog: Annual Summary

The LNG market grew strongly in 2019. Global Imports (net of re-exports and domestic shipment, Fig_1&2) were up by 12.2% to reach 350.5 Mt (+38 Mt Y-o-Y) driven by the arrival of abundant LNG supply.  In a context of weak growth in Asia (+5 Mt Y-O-Y  compared to +27 Mt Y-o-Y in 2018) , which had been the driving force in previous years, Europe absorbed the bulk of the new volumes (+37 Mt), acting as a market of last resort. In all other regions, combined net imports’ decline was -4 Mt (Includes -2.3 Mt from Egypt in North Africa as it ceased LNG imports). As the growth in LNG supply outpaced demand, prices plummeted, reinforcing the competitiveness of gas in Europe.

Figure_1: Monthly Evolution of LNG Trade Y-O-Y (Mt)
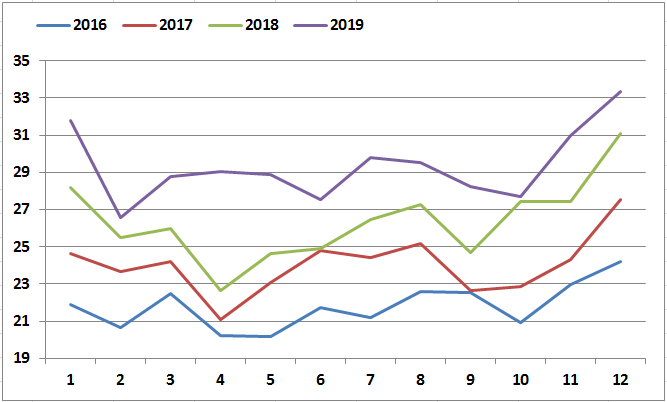
Monthly Evolution of LNG Trade Y-O-Y

Source: Cedigaz

Quarterly report – Oil and natural gas prices

  • Brent: between $60 and $80/b in 2019 (2018: $71/b)

The oil price oscillated between $50 and $86/b in 2018, averaging $71/b (+31% compared to 2017). The volatility observed in 2018 was due in large part to uncertainty about supply and economic growth, but also to the U.S. sanctions against Iran. Initially announced as being extremely severe, the embargo was softened at the last minute by the American president when he realized the likely consequences of a rise in the price of oil products.

For 2019, the average Brent price is expected to be in the $60 to 80/b range. These expectations account for different scenarios for factors such as economic growth, the Iran embargo, OPEC’s management of supply and U.S. production.

Brent: between $60 and $80/b in 2019

  • NBP: €19-23/MWh in 2019 (€23.3/MWh; $8.1/MBtu in 2018)

Based on forward prices and expected oil prices, the average UK NBP price for 2019 could fall between €19 and 23/MWh ($6.5-7.8/MBtu) compared to €23,3/MWh ($8.1/MBtu) in 2018, representing a potential decrease of between 1 and 18%.

Quarterly report – Natural gas prices

– In Asia, the average price of gas imports to Japan has risen since year-end 2017 in step with the uptrend in the oil price. LNG spot prices are under pressure and approaching those of oil-indexed contracts.

– These conditions have affected the European market, where price levels for Q2 and Q3 are relatively high.

– In the U.S., the Henry Hub price was lower in Q2 than Q1, due to the magnitude of U.S. natural gas output.

Globally, based on current information, average 2018 prices look to be up sharply in Europe (+36%) and Asia (+30-40%), but down in the United States (-3%).


Figure 1: 2017-19 gas price, by quarter: United Kingdom, Japan and the United States ($/MBtu and €/MWh)

2017-19 gas price, by quarter


Global trends

Global trends