The LNG market in June 2020 : Qatar at full speed, US in slow motion.

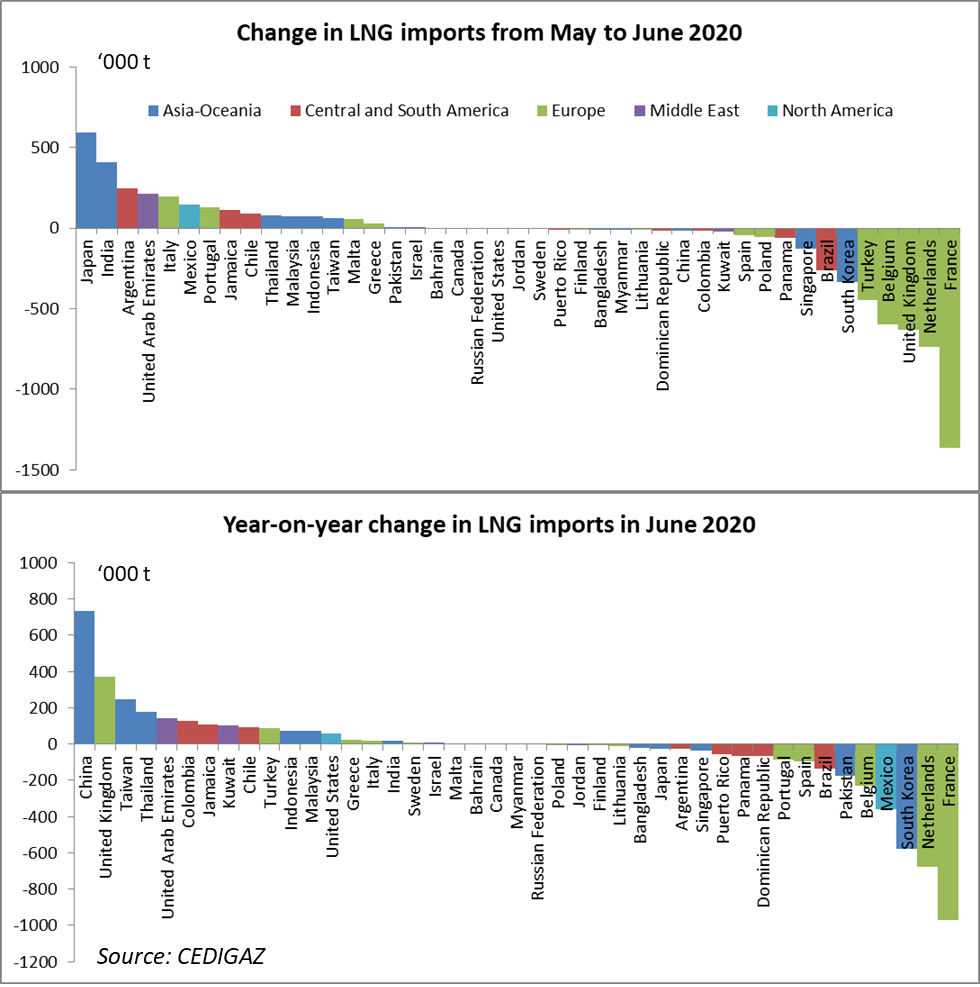
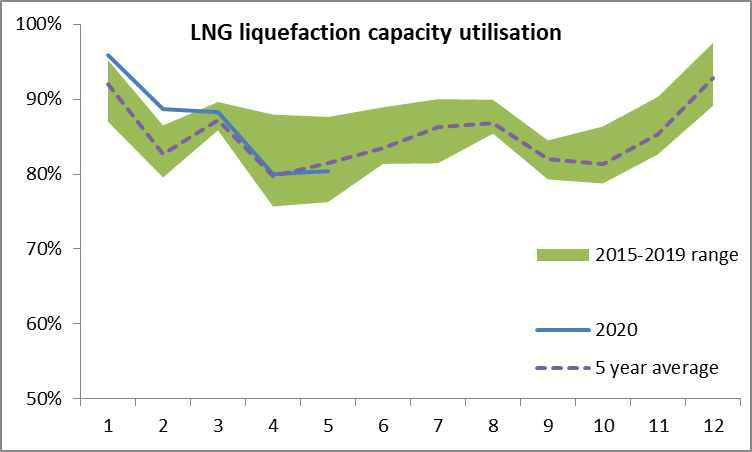
Global LNG import[1] decline accelerated in June. Preliminary data[2] point to an 8% drop (-2.3 Mt) compared to May and a 4.2% decline (-1.2 Mt) year-on-year. Global net imports stood at an estimated 26.3 Mt, which is equivalent to only 72% of global liquefaction capacity, a level significantly below the 5 year capacity utilization range in June for the 2015-2019 period (81-89%). This signals a growing oversupply in the first semester as capacity utilization had remained within the 5 year range until May and shows that the LNG market flexibility needed to absorb the surplus is being stretched to its limits.


The strong decline in June is due to Europe where imports nosedived in several major importing countries : France (- 1.4 Mt), Netherlands (-0.7 Mt), UK (-0.6 Mt), Belgium (-0.6 Mt) and Turkey (-0.5 Mt). Overall European imports (including Turkey) were down 40% in June compared to May (-3.5 Mt). All other regions registered modest growths. In particular imports grew by 0.8 Mt in Asia essentially thanks to Japan (+0.6 Mt) and India (+0.4 Mt) while they declined in South Korea (-0.3 Mt) and remained almost stable in China. The year-on-year picture is less dramatic with imports down by 1.5 Mt (-23%) in Europe, essentially due to France and the Netherlands and up 0.5 Mt in Asia essentially because of China (+0.7 Mt) while South Korean imports declined by 0.5 Mt.

LNG imports 2020

Global LNG Review – May 2020

Global LNG trade remained stable year on year in May 2020 amid extremely depressed prices

Global LNG net imports* were up 0.46 Mt  in May 2020 compared to April and essentially stable year-on-year (-0.2%) after a 2% Y-o-Y decline in April. These figures contrast with the 11.5% Y-o-Y growth recorded in Q1. Global net imports in May were 13% below January’s which demonstrates a certain level of supply response to low prices but is also largely a seasonal phenomenon. Indeed, in the five year period between 2015 and 2019, the decline in monthly imports from January to April has varied from -20% in 2015 to -6% in 2017.

LNG exports in May 2020 represented approximately 82% of the global liquefaction installed capacity which was only marginally lower than the average capacity utilization at this time of the year over the 5 previous year. They increased by 1% compared to May 2019, with the largest increases in the United States, Nigeria, Algeria and the Russian Federation, reflecting higher capacity utilization in the latter three countries and the launch of a number of new liquefaction trains in 2019 and early 2020 in the United States, where nominal liquefaction capacity increased from 34 to 65 Mtpa between May 2019 and May 2020.

LNG liquefaction capacity utilisation

Source: CEDIGAZ

Cedigaz LNG Blog: Annual Summary

The LNG market grew strongly in 2019. Global Imports (net of re-exports and domestic shipment, Fig_1&2) were up by 12.2% to reach 350.5 Mt (+38 Mt Y-o-Y) driven by the arrival of abundant LNG supply.  In a context of weak growth in Asia (+5 Mt Y-O-Y  compared to +27 Mt Y-o-Y in 2018) , which had been the driving force in previous years, Europe absorbed the bulk of the new volumes (+37 Mt), acting as a market of last resort. In all other regions, combined net imports’ decline was -4 Mt (Includes -2.3 Mt from Egypt in North Africa as it ceased LNG imports). As the growth in LNG supply outpaced demand, prices plummeted, reinforcing the competitiveness of gas in Europe.

Figure_1: Monthly Evolution of LNG Trade Y-O-Y (Mt)

Monthly Evolution of LNG Trade Y-O-Y

Source: Cedigaz