The Global LNG Trade in 2015 : Cedigaz’ First Estimates

According to Cedigaz’ First Estimates, LNG imports grew by 2.1% in 2015 to 241.2 Mt. Main highlights include the reversal of growth trends in Asia and in Europe, the emerging role of the MENA countries as LNG importers and the growth of intraregional and intra-basin trade due to the convergence of global prices.

Change in growth trends in Asia and Europe

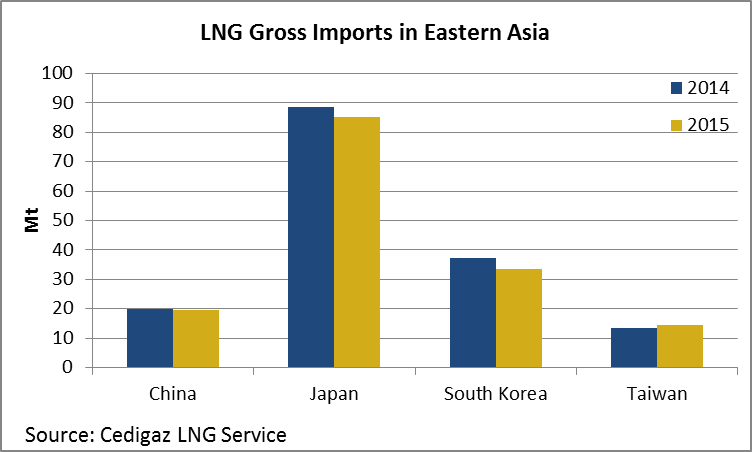
After many years of growing demand in Asia and declining demand in Europe, trends changed on the two largest LNG markets in 2015. For the first time since 2009, Asian LNG net imports declined by 2.8% to 172.8 Mt (-5Mt) mainly because of weather related factors, gas-fuel competiveness and the slowdown of economic growth. The bulk of the decline came from Japan and South Korea, the two biggest importers in the world: in these two countries, LNG net imports declined respectively to 85 Mt and 33.4 Mt which represents a combined decline of 7.2 Mt (-5.8 %). In a context of slowing economic growth and poor gas price competitiveness, Chinese demand dwindled by 0.9% to 19.7 Mt while LNG imports grew at an average annual rate of 20.1% from 2010 to 2014. Rising imports in Thailand (+ 1.3 Mt to 2.6 Mt) and Taiwan (+1.1 Mt to 14.6 Mt), as well as the beginning of imports in Pakistan (above 1 Mt) did not suffice to offset the regional decline.

Eastern Asian LNG gross imports declined by 3.9% in 2015 to 152.8 Mt

Eastern Asian LNG gross imports fell by 3.9% in 2015

In 2015, LNG imports in Japan, South Korea, China and Taiwan reached a total of 152.8 Mt, which represents a 3.9% decrease compared to 2014 (159 Mt). The drop was steady throughout the year, even though it slowed down in the fourth quarter, when imports decreased by 3.1% year-on-year against a rate of over 4% in the previous quarters.

Eastern Asian LNG gross imports fellIn Japan, which accounts for about a third of the world LNG consumption, imports dropped by 3.9%, from 88.5 Mt in 2014 to 85 Mt in 2015. The bulk of the decline was caused by the drop of LNG use in the power sector: the ten privately-owned electric power companies of Japan, which bought 55.7 Mt of LNG in 2015, reduced their consumption of LNG by 4.8% (-2.7 Mt). On the one hand, this decline is explained by an overall drop in power generation in 2015 (-5.1% to 685 TWh) caused by above than average temperature in the spring and lower than average temperature in June and September, which reduced demand for heating and cooling. On the other hand, the 13.7 % increase of hydro, new energy and nuclear power impacted the use of thermal plants. The electricity generated by thermal plants declined by 6.8% so that besides LNG, consumption of coal, heavy fuel oil and crude oil by power companies decreased by 1.6%, 19.3% and 23.4% respectively. In addition, city gas sales of the top-3 natural gas utilities dropped by 0.9% mostly because of lower consumption in the residential and business sectors.

European LNG net imports grew by 16.6 % in 2015

European LNG net imports grew by 16.6% in 2015

LNG net imports in EuropeIn 2015, LNG net imports grew by 16.6% in Europe as demand for natural gas grew in the region. As a consequence of more deliveries (+1.8 Mt) and less reloads (-2.68 Mt), net imports increased by 4.47 Mt up to 31.35 Mt. Except in France, where gross imports decreased from 5.07 Mt to 4.77 Mt while re-expors slightly decreased (-0.03 Mt), and in Greece, where imports were flat at around 0.45 Mt, net imports increased everywhere because of various factors.